In May 2024, Orange County homes were selling for an average price of $482,978, Orange County homes on average sell after 41 days on the market compared to 33 days last year. There were 10075 homes sold in Orange County for May 2024, compared to 10651 last year.
The average list price of Orange County, was $626,833 in May 2024, compared to $567,862 in May 2023.
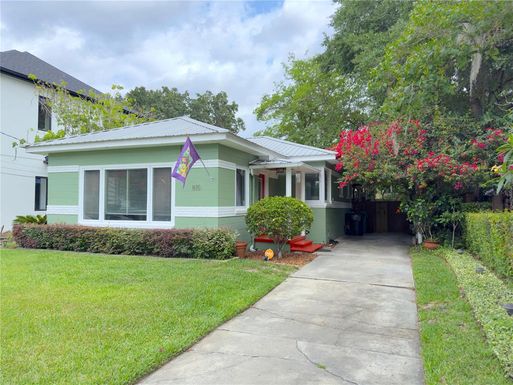
Orange County Market Trend for Houses
Average List Price
The average list price of houses in Orange County, was $804,522 in May 2024, compared to $643,338 in May 2023.
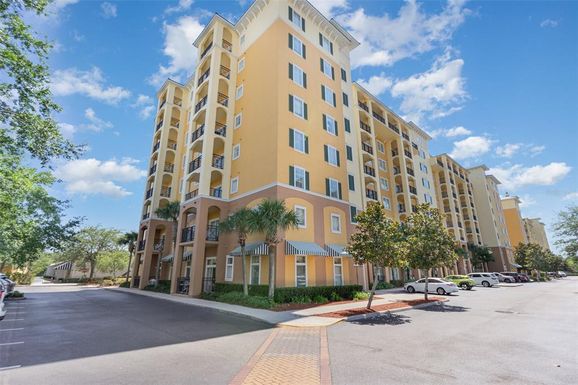
Orange County Market Trend for Condos / Townhouses / Penthouses
Average List Price
The average list price of condos/co-ops in Orange County, was $330,425 in May 2024, compared to $338,456 in May 2023.
Orange County Market Trend for Lots/Land
Average List Price
The average list price of lots/land in Orange County, was $952,527 in May 2024, compared to $847,383 in May 2023.
Orange County Market Trend for Commercial
Average List Price
The average list price of commercial in Orange County, was $1,258,289 in May 2024, compared to $1,298,403 in May 2023.
Orange County Housing Market Analysis
The average list price in Orange County is $626,833. The average list price in Orange County went up 9.05% from 2023 to 2024. Orange County home resale inventories is 2803, which increased 24.41% since 2023. The average list price per square foot in Orange County is $287. 2023 it was $264.