In June 2024, 32134, FL homes were selling for an average price of $163,403, 32134, FL homes on average sell after 115 days on the market compared to 87 days last year. There were 252 homes sold in 32134, FL for June 2024, compared to 243 last year.
The average list price of 32134, FL, was $191,681 in June 2024, compared to $179,606 in June 2023.
32134, FL Market Trend for Houses
Average List Price
The average list price of houses in 32134, FL, was $474,037 in June 2024, compared to $294,162 in June 2023.
32134, FL Market Trend for Condos / Townhouses / Penthouses
Average List Price
The average list price of condos/co-ops in 32134, FL, was $164,000 in June 2024, compared to $0 in June 2023.
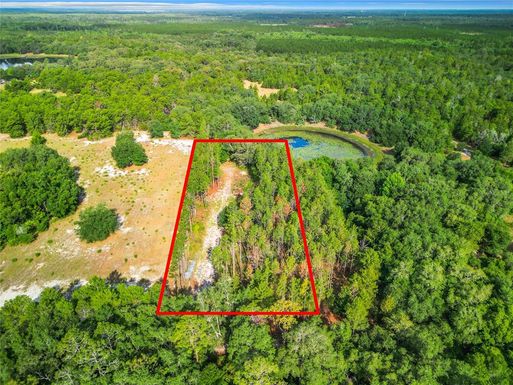
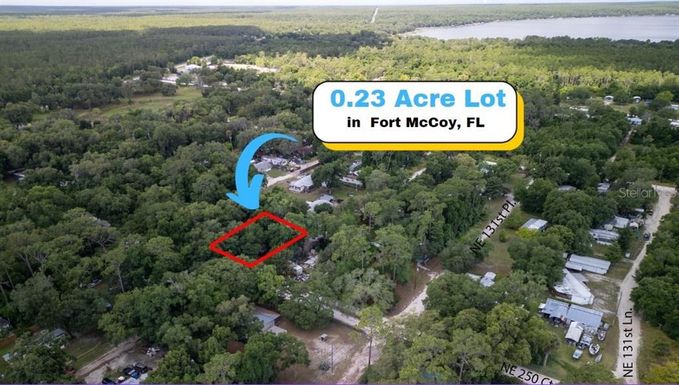
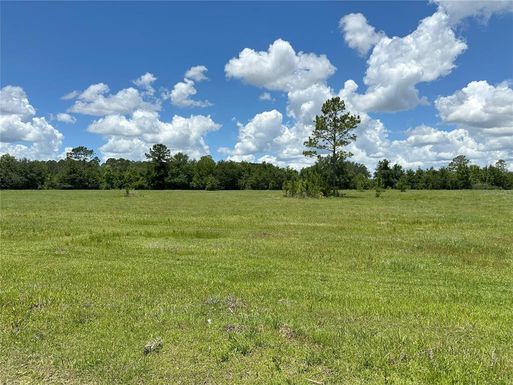
32134, FL Market Trend for Lots/Land
Average List Price
The average list price of lots/land in 32134, FL, was $88,987 in June 2024, compared to $119,894 in June 2023.
32134, FL Market Trend for Commercial
Average List Price
The average list price of commercial in 32134, FL, was $163,100 in June 2024, compared to $197,760 in June 2023.
32134, FL Housing Market Analysis
The average list price in 32134, FL is $191,681. The average list price in 32134, FL went up 7.45% from 2023 to 2024. 32134, FL home resale inventories is 196, which increased 106.32% since 2023. The average list price per square foot in 32134, FL is $257. 2023 it was $182.