In May 2024, 32145, FL homes were selling for an average price of $139,428, 32145, FL homes on average sell after 141 days on the market compared to 75 days last year. There were 126 homes sold in 32145, FL for May 2024, compared to 95 last year.
The average list price of 32145, FL, was $144,212 in May 2024, compared to $154,983 in May 2023.
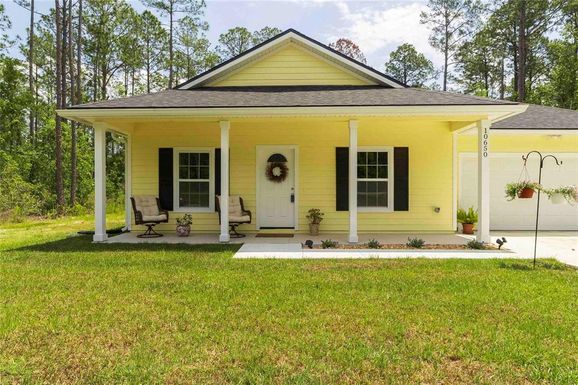
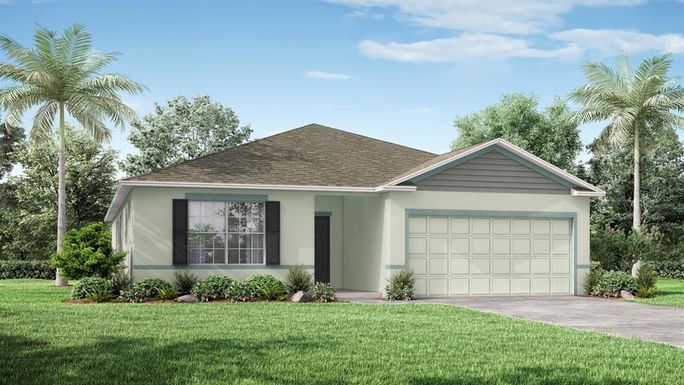
32145, FL Market Trend for Houses
Average List Price
The average list price of houses in 32145, FL, was $356,835 in May 2024, compared to $323,138 in May 2023.
32145, FL Market Trend for Condos / Townhouses / Penthouses
Average List Price
The average list price of condos/co-ops in 32145, FL, was $0 in May 2024, compared to $0 in May 2023.
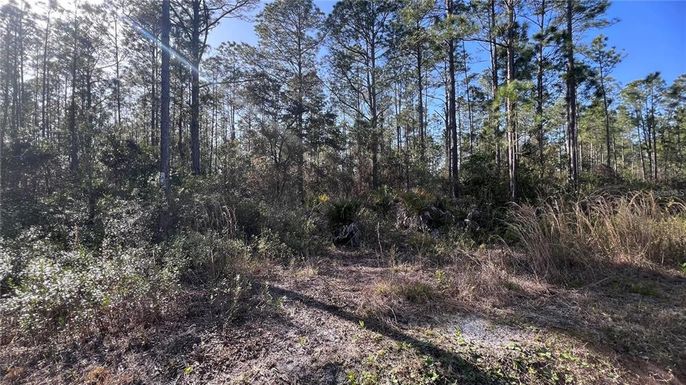
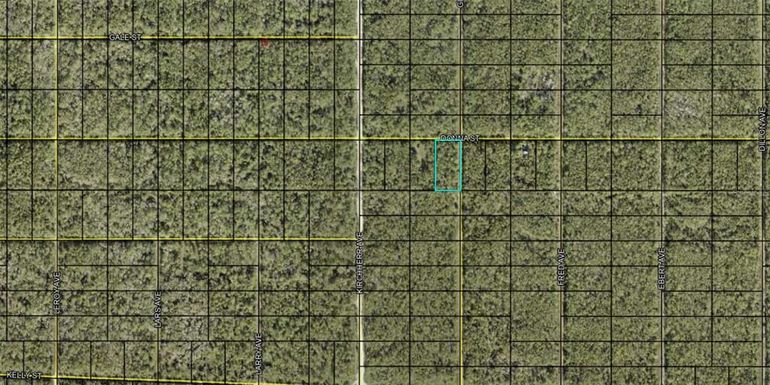
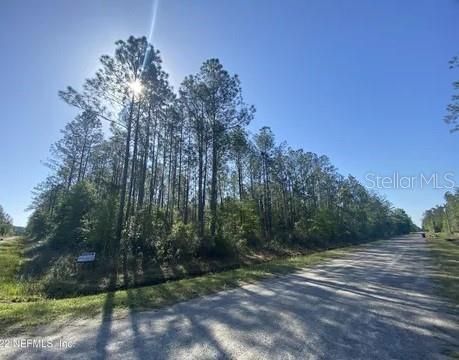
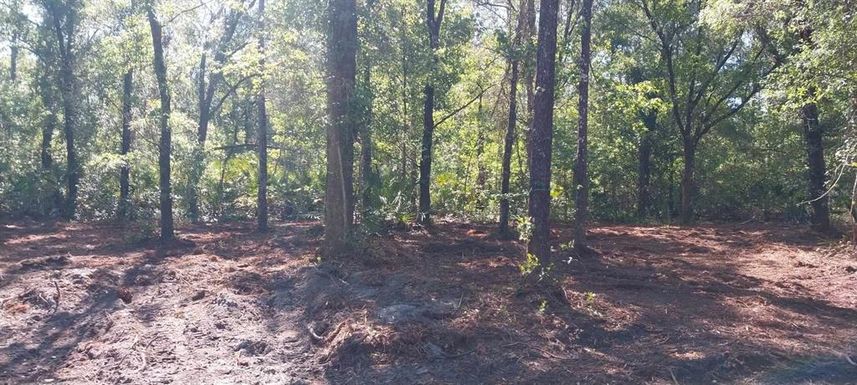
32145, FL Market Trend for Lots/Land
Average List Price
The average list price of lots/land in 32145, FL, was $48,906 in May 2024, compared to $54,835 in May 2023.
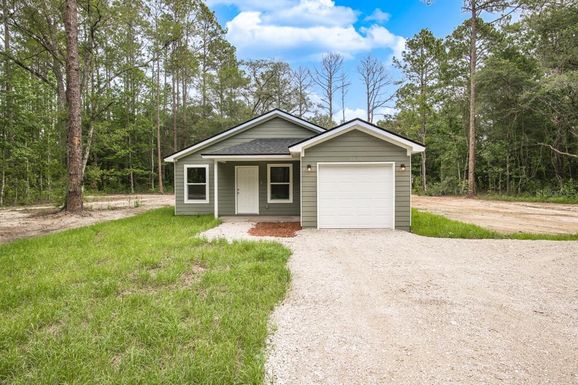
32145, FL Market Trend for Commercial
Average List Price
The average list price of commercial in 32145, FL, was $42,450 in May 2024, compared to $9,400 in May 2023.
32145, FL Housing Market Analysis
The average list price in 32145, FL is $144,212. The average list price in 32145, FL went down 1.70% from 2023 to 2024. 32145, FL home resale inventories is 80, which increased 45.45% since 2023. The average list price per square foot in 32145, FL is $208. 2023 it was $209.