In June 2024, 32686, FL homes were selling for an average price of $708,715, 32686, FL homes on average sell after 102 days on the market compared to 92 days last year. There were 73 homes sold in 32686, FL for June 2024, compared to 102 last year.
The average list price of 32686, FL, was $1,889,118 in June 2024, compared to $2,182,619 in June 2023.
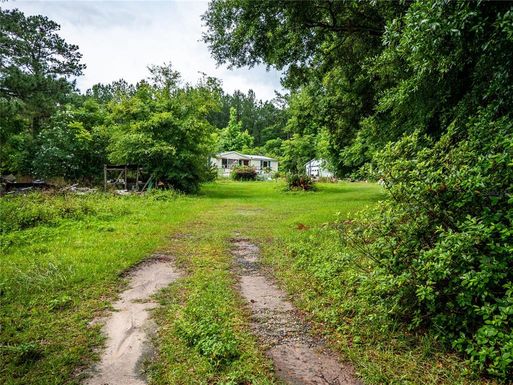
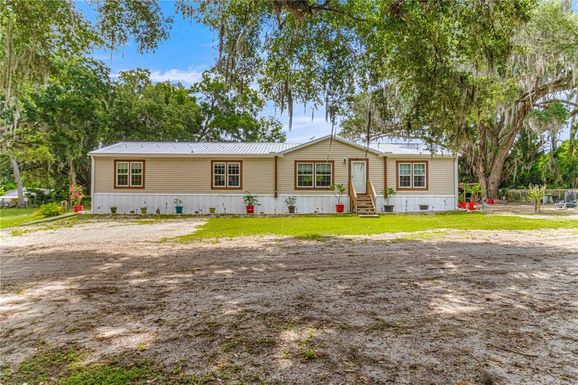
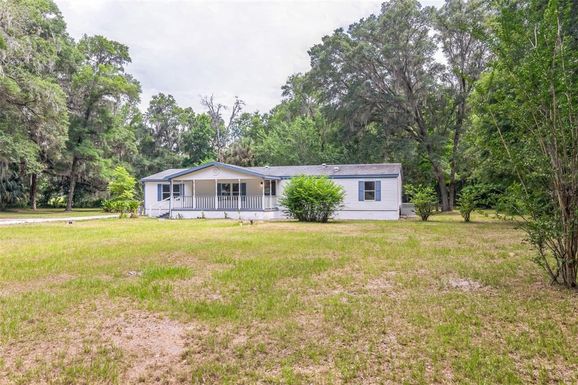
32686, FL Market Trend for Houses
Average List Price
The average list price of houses in 32686, FL, was $1,079,040 in June 2024, compared to $267,960 in June 2023.
32686, FL Market Trend for Condos / Townhouses / Penthouses
Average List Price
The average list price of condos/co-ops in 32686, FL, was $0 in June 2024, compared to $0 in June 2023.
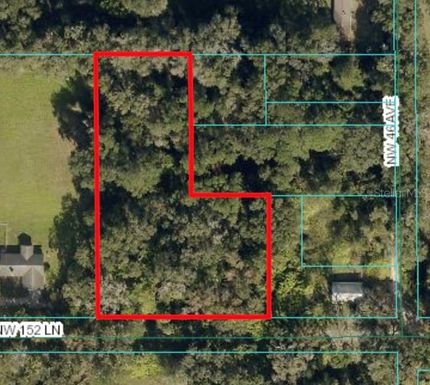
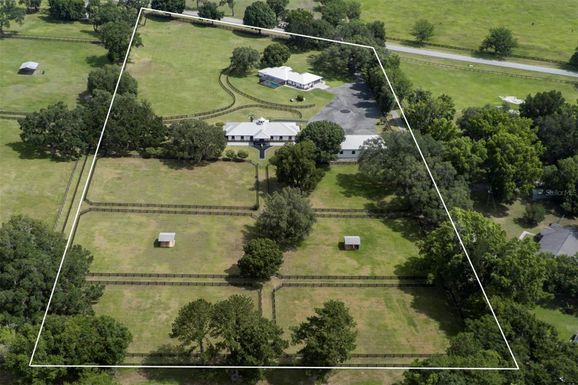
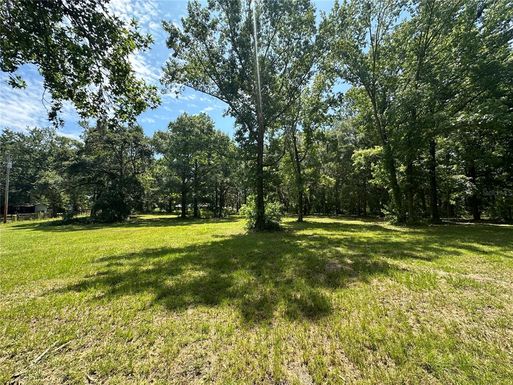
32686, FL Market Trend for Lots/Land
Average List Price
The average list price of lots/land in 32686, FL, was $1,904,558 in June 2024, compared to $2,674,494 in June 2023.
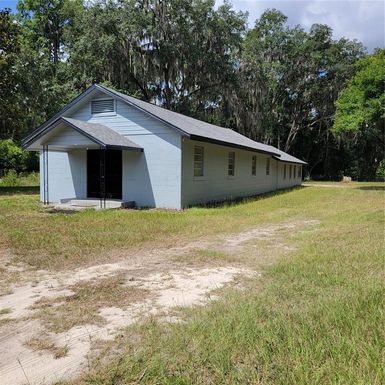
32686, FL Market Trend for Commercial
Average List Price
The average list price of commercial in 32686, FL, was $461,333 in June 2024, compared to $0 in June 2023.
32686, FL Housing Market Analysis
The average list price in 32686, FL is $1,889,118. The average list price in 32686, FL went down 11.17% from 2023 to 2024. 32686, FL home resale inventories is 79, which increased 146.88% since 2023. The average list price per square foot in 32686, FL is $630. 2023 it was $466.