In January 2026, 33019, FL homes were selling for an average price of $885,394, 33019, FL homes on average sell after 130 days on the market compared to 94 days last year. There were 416 homes sold in 33019, FL for January 2026, compared to 419 last year.
The average list price of 33019, FL, was $1,049,258 in January 2026, compared to $877,892 in January 2025.
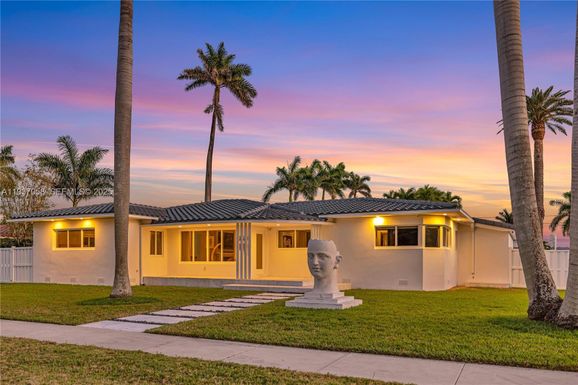
33019, FL Market Trend for Houses
Average List Price
The average list price of houses in 33019, FL, was $2,008,175 in January 2026, compared to $1,711,469 in January 2025.
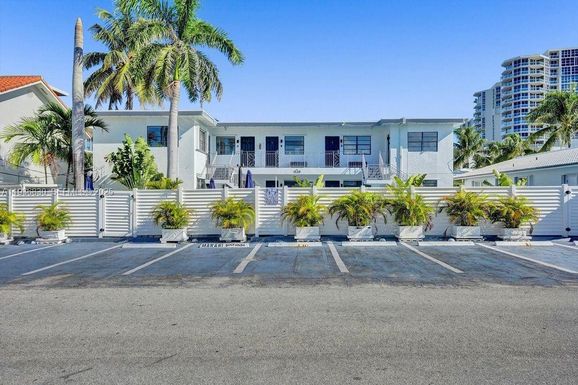
33019, FL Market Trend for Condos / Townhouses / Penthouses
Average List Price
The average list price of condos/co-ops in 33019, FL, was $757,931 in January 2026, compared to $694,725 in January 2025.
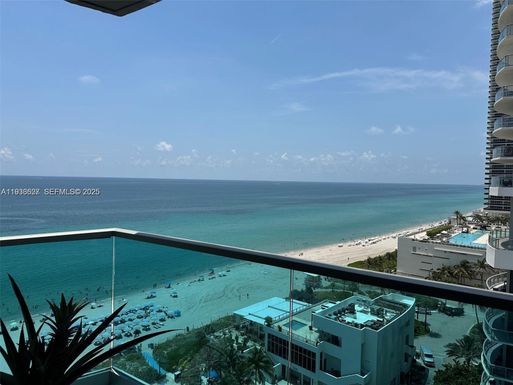
33019, FL Market Trend for Lots/Land
Average List Price
The average list price of lots/land in 33019, FL, was $2,540,700 in January 2026, compared to $0 in January 2025.
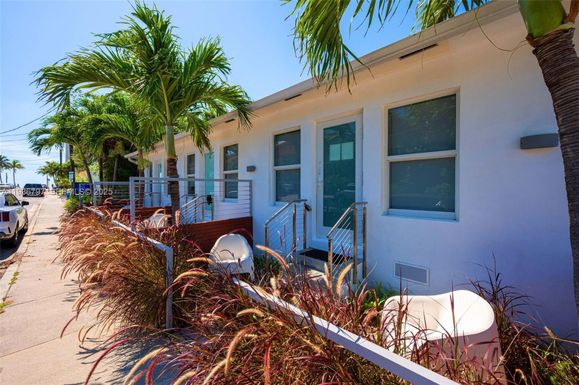
33019, FL Market Trend for Commercial
Average List Price
The average list price of commercial in 33019, FL, was $2,539,865 in January 2026, compared to $1,628,333 in January 2025.
33019, FL Housing Market Analysis
The average list price in 33019, FL is $1,049,258. The average list price in 33019, FL went up 15.21% from 2025 to 2026. 33019, FL home resale inventories is 692, which increased 123.95% since 2025. The average list price per square foot in 33019, FL is $607. 2025 it was $600.