In June 2024, 33029, FL homes were selling for an average price of $758,430, 33029, FL homes on average sell after 38 days on the market compared to 39 days last year. There were 389 homes sold in 33029, FL for June 2024, compared to 445 last year.
The average list price of 33029, FL, was $901,913 in June 2024, compared to $726,518 in June 2023.
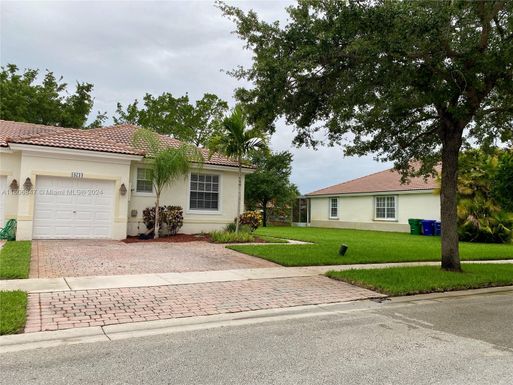
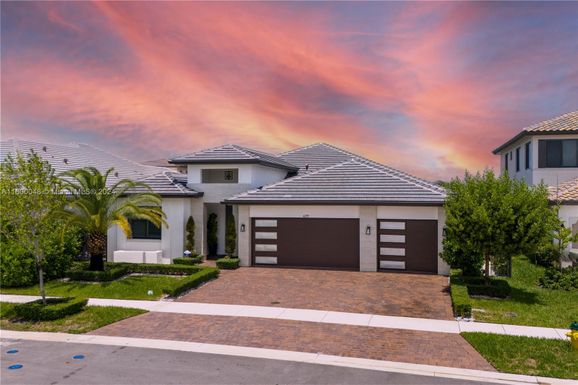
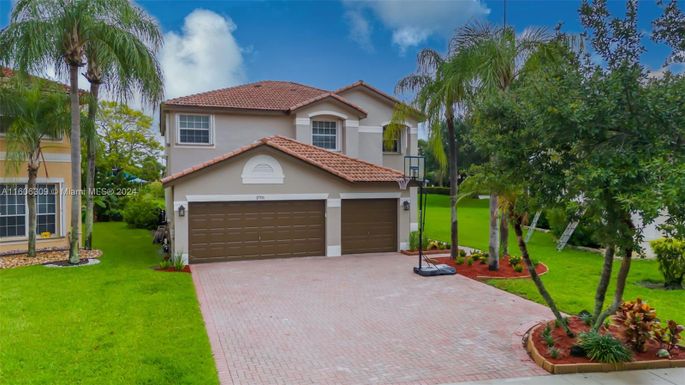
33029, FL Market Trend for Houses
Average List Price
The average list price of houses in 33029, FL, was $929,972 in June 2024, compared to $767,161 in June 2023.
33029, FL Market Trend for Condos / Townhouses / Penthouses
Average List Price
The average list price of condos/co-ops in 33029, FL, was $499,255 in June 2024, compared to $499,300 in June 2023.
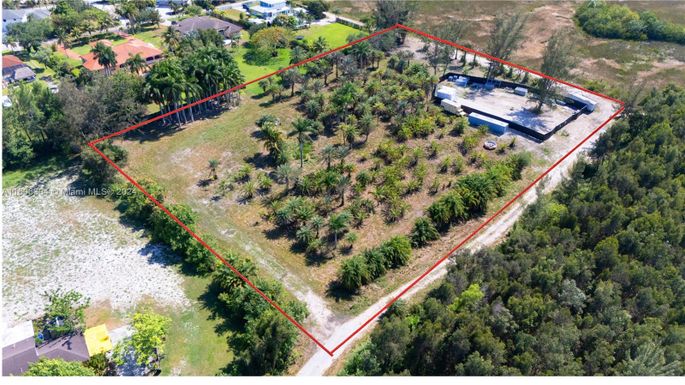
33029, FL Market Trend for Lots/Land
Average List Price
The average list price of lots/land in 33029, FL, was $2,700,000 in June 2024, compared to $123,000 in June 2023.
33029, FL Market Trend for Commercial
Average List Price
The average list price of commercial in 33029, FL, was $909,029 in June 2024, compared to $472,400 in June 2023.
33029, FL Housing Market Analysis
The average list price in 33029, FL is $901,913. The average list price in 33029, FL went up 23.97% from 2023 to 2024. 33029, FL home resale inventories is 111, which increased 20.65% since 2023. The average list price per square foot in 33029, FL is $356. 2023 it was $314.