In January 2026, 33133, FL homes were selling for an average price of $2,420,330, 33133, FL homes on average sell after 97 days on the market compared to 82 days last year. There were 539 homes sold in 33133, FL for January 2026, compared to 543 last year.
The average list price of 33133, FL, was $3,780,032 in January 2026, compared to $2,512,547 in January 2025.
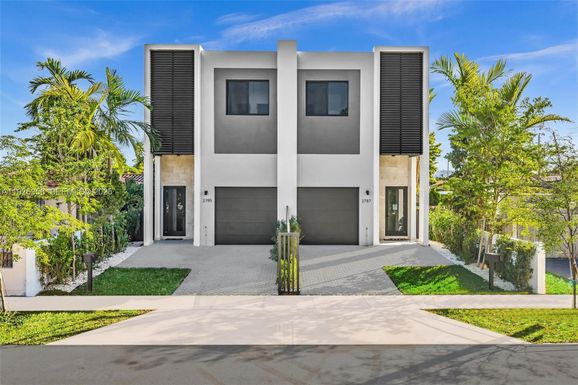
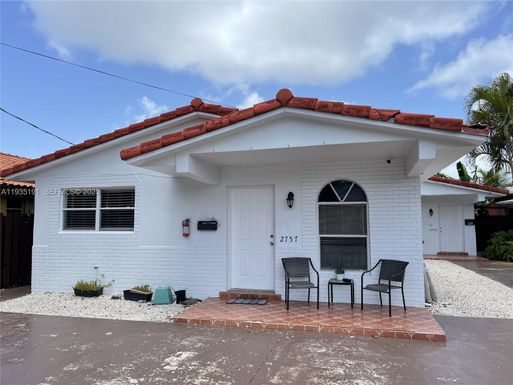
33133, FL Market Trend for Houses
Average List Price
The average list price of houses in 33133, FL, was $5,857,390 in January 2026, compared to $3,234,734 in January 2025.
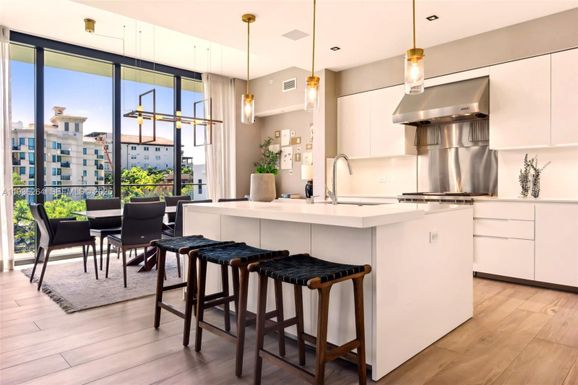
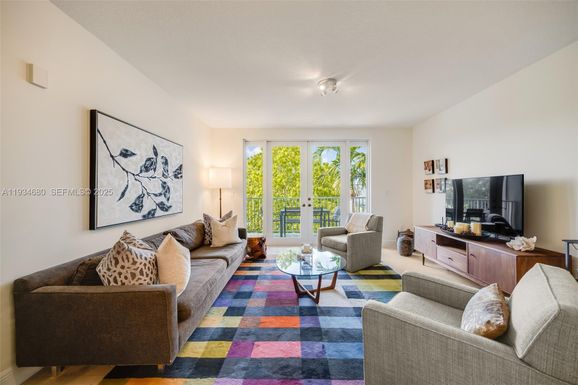
33133, FL Market Trend for Condos / Townhouses / Penthouses
Average List Price
The average list price of condos/co-ops in 33133, FL, was $2,563,173 in January 2026, compared to $2,370,481 in January 2025.
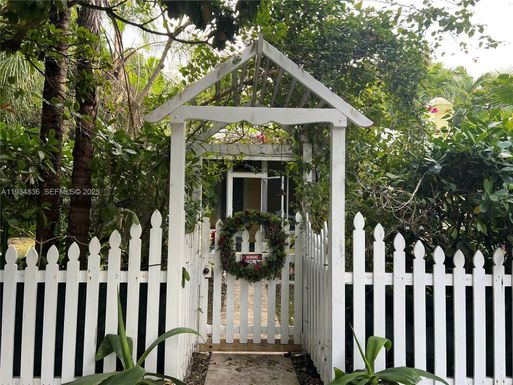
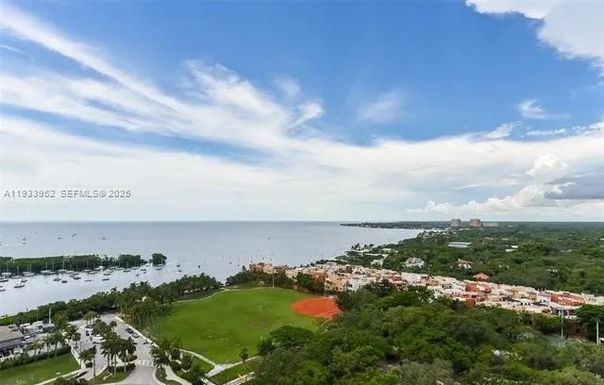
33133, FL Market Trend for Lots/Land
Average List Price
The average list price of lots/land in 33133, FL, was $4,601,190 in January 2026, compared to $2,579,875 in January 2025.
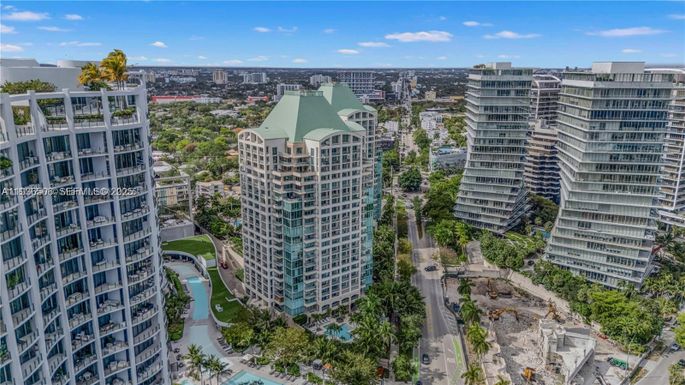
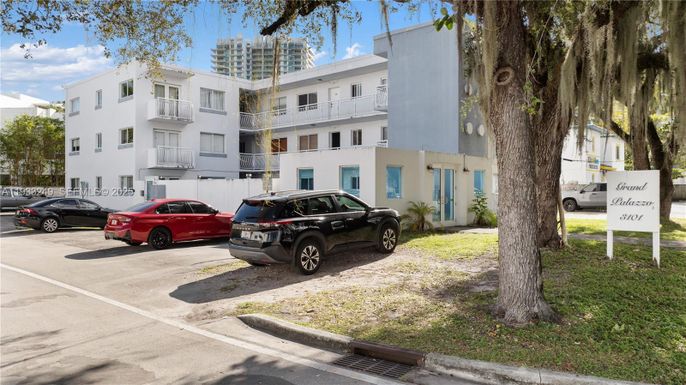
33133, FL Market Trend for Commercial
Average List Price
The average list price of commercial in 33133, FL, was $4,652,900 in January 2026, compared to $1,448,416 in January 2025.
33133, FL Housing Market Analysis
The average list price in 33133, FL is $3,780,032. The average list price in 33133, FL went up 35.78% from 2025 to 2026. 33133, FL home resale inventories is 379, which increased 69.20% since 2025. The average list price per square foot in 33133, FL is $1,208. 2025 it was $1,107.