In June 2024, 33435, FL homes were selling for an average price of $694,913, 33435, FL homes on average sell after 85 days on the market compared to 56 days last year. There were 931 homes sold in 33435, FL for June 2024, compared to 933 last year.
The average list price of 33435, FL, was $838,865 in June 2024, compared to $783,099 in June 2023.
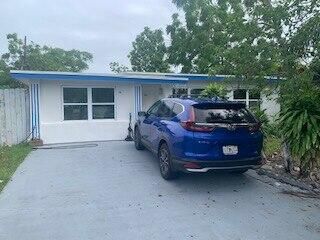
33435, FL Market Trend for Houses
Average List Price
The average list price of houses in 33435, FL, was $1,679,898 in June 2024, compared to $1,543,774 in June 2023.
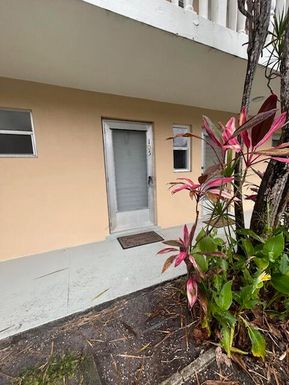
33435, FL Market Trend for Condos / Townhouses / Penthouses
Average List Price
The average list price of condos/co-ops in 33435, FL, was $453,833 in June 2024, compared to $332,007 in June 2023.
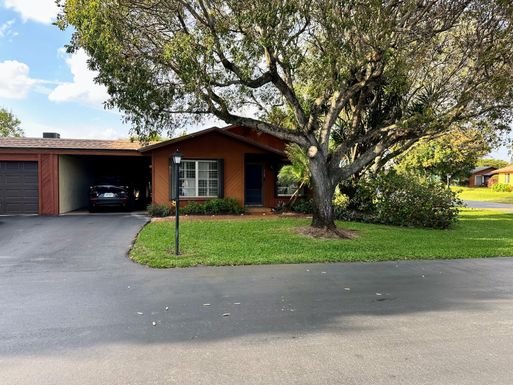
33435, FL Market Trend for Lots/Land
Average List Price
The average list price of lots/land in 33435, FL, was $1,632,500 in June 2024, compared to $0 in June 2023.
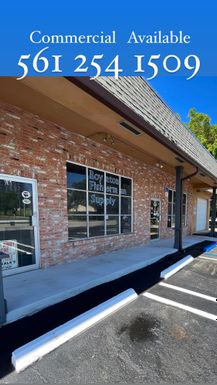
33435, FL Market Trend for Commercial
Average List Price
The average list price of commercial in 33435, FL, was $1,248,469 in June 2024, compared to $1,365,654 in June 2023.
33435, FL Housing Market Analysis
The average list price in 33435, FL is $838,865. The average list price in 33435, FL went up 33.35% from 2023 to 2024. 33435, FL home resale inventories is 407, which increased 60.87% since 2023. The average list price per square foot in 33435, FL is $424. 2023 it was $352.