In June 2024, 33919, FL homes were selling for an average price of $272,700, 33919, FL homes on average sell after 71 days on the market compared to 28 days last year. There were 10 homes sold in 33919, FL for June 2024, compared to 3 last year.
The average list price of 33919, FL, was $481,857 in June 2024, compared to $99,950 in June 2023.
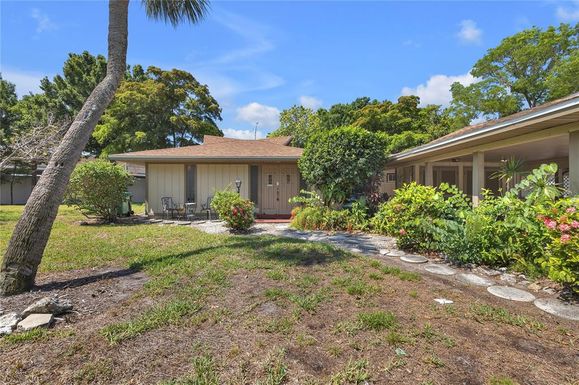
33919, FL Market Trend for Houses
Average List Price
The average list price of houses in 33919, FL, was $682,392 in June 2024, compared to $0 in June 2023.
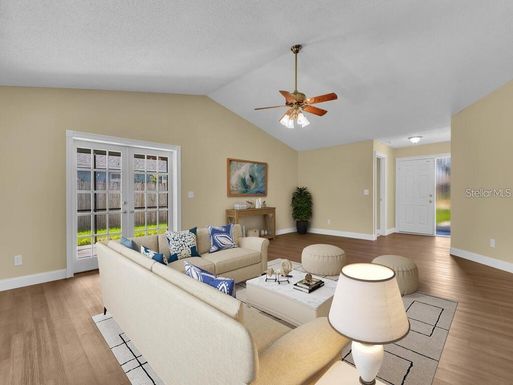
33919, FL Market Trend for Condos / Townhouses / Penthouses
Average List Price
The average list price of condos/co-ops in 33919, FL, was $237,537 in June 2024, compared to $169,900 in June 2023.
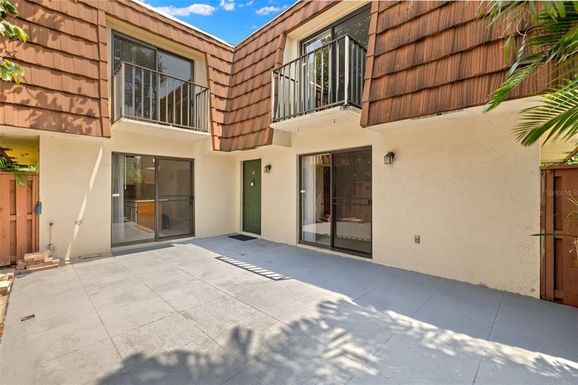
33919, FL Market Trend for Lots/Land
Average List Price
The average list price of lots/land in 33919, FL, was $30,000 in June 2024, compared to $30,000 in June 2023.
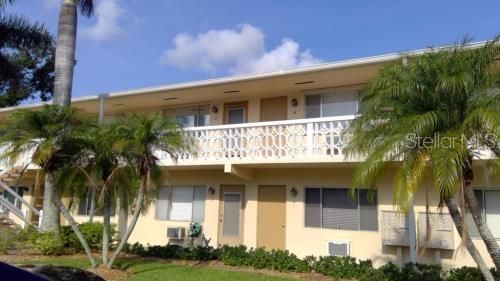
33919, FL Market Trend for Commercial
Average List Price
The average list price of commercial in 33919, FL, was $0 in June 2024, compared to $0 in June 2023.
33919, FL Housing Market Analysis
The average list price in 33919, FL is $481,857. The average list price in 33919, FL went up 382.10% from 2023 to 2024. 33919, FL home resale inventories is 21, which increased 950.00% since 2023. The average list price per square foot in 33919, FL is $292. 2023 it was $167.