In May 2024, 34216, FL homes were selling for an average price of $3,051,468, 34216, FL homes on average sell after 95 days on the market compared to 67 days last year. There were 77 homes sold in 34216, FL for May 2024, compared to 70 last year.
The average list price of 34216, FL, was $3,697,366 in May 2024, compared to $3,804,729 in May 2023.
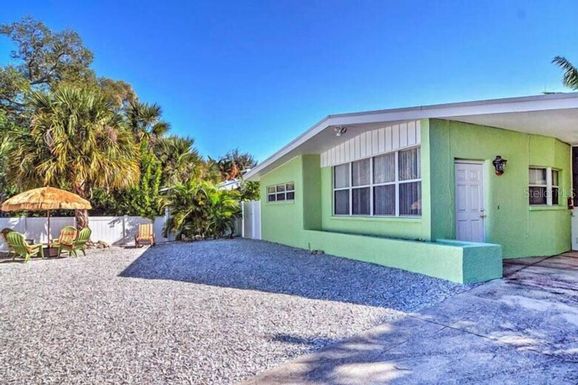
34216, FL Market Trend for Houses
Average List Price
The average list price of houses in 34216, FL, was $3,827,437 in May 2024, compared to $3,583,196 in May 2023.
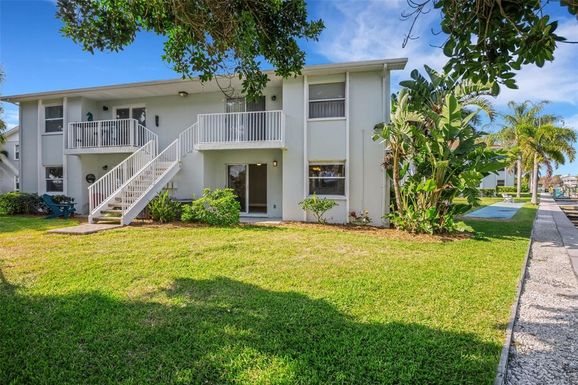
34216, FL Market Trend for Condos / Townhouses / Penthouses
Average List Price
The average list price of condos/co-ops in 34216, FL, was $695,000 in May 2024, compared to $0 in May 2023.
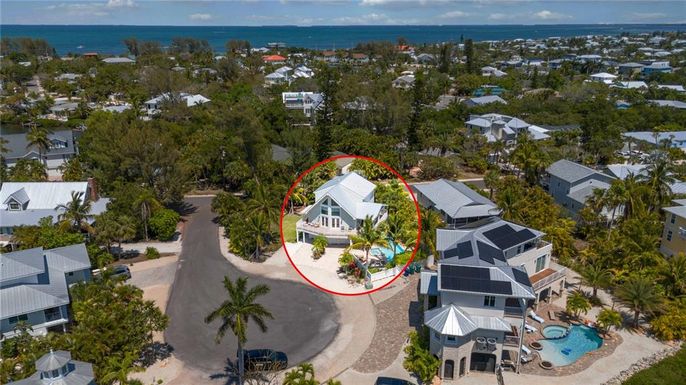
34216, FL Market Trend for Lots/Land
Average List Price
The average list price of lots/land in 34216, FL, was $4,515,667 in May 2024, compared to $8,900,000 in May 2023.
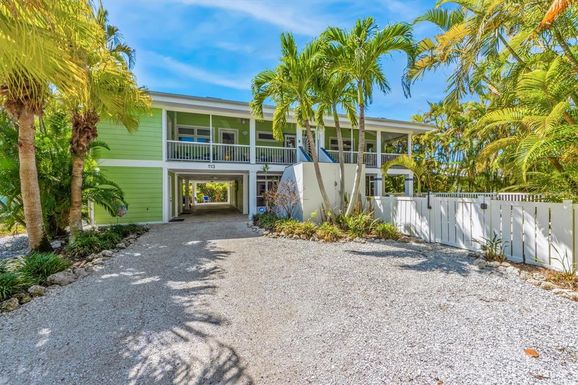
34216, FL Market Trend for Commercial
Average List Price
The average list price of commercial in 34216, FL, was $1,449,000 in May 2024, compared to $0 in May 2023.
34216, FL Housing Market Analysis
The average list price in 34216, FL is $3,697,366. The average list price in 34216, FL went up 8.37% from 2023 to 2024. 34216, FL home resale inventories is 101, which increased 248.28% since 2023. The average list price per square foot in 34216, FL is $1,477. 2023 it was $1,358.