In May 2024, 34236, FL homes were selling for an average price of $1,676,177, 34236, FL homes on average sell after 68 days on the market compared to 50 days last year. There were 594 homes sold in 34236, FL for May 2024, compared to 450 last year.
The average list price of 34236, FL, was $2,698,161 in May 2024, compared to $2,083,565 in May 2023.
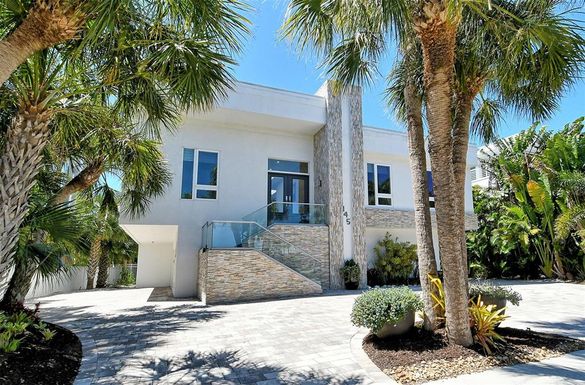
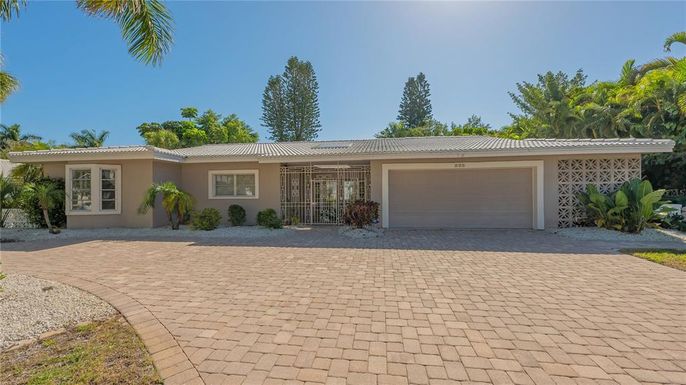
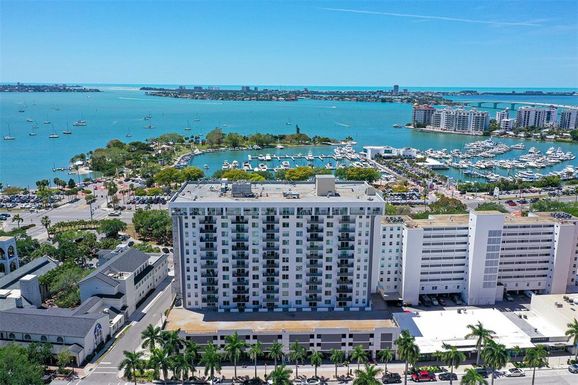
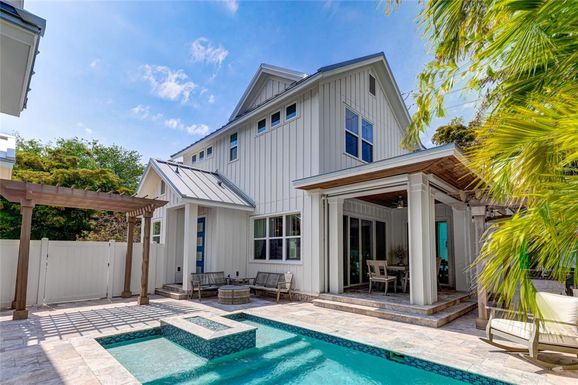
34236, FL Market Trend for Houses
Average List Price
The average list price of houses in 34236, FL, was $3,954,767 in May 2024, compared to $3,853,781 in May 2023.
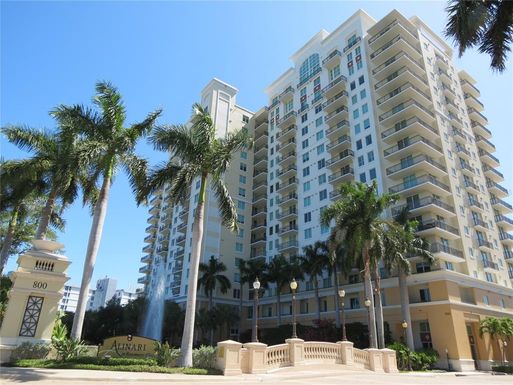
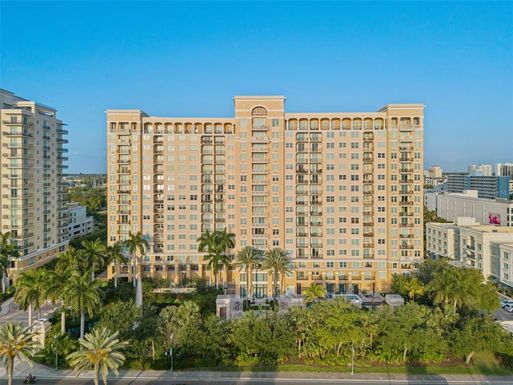
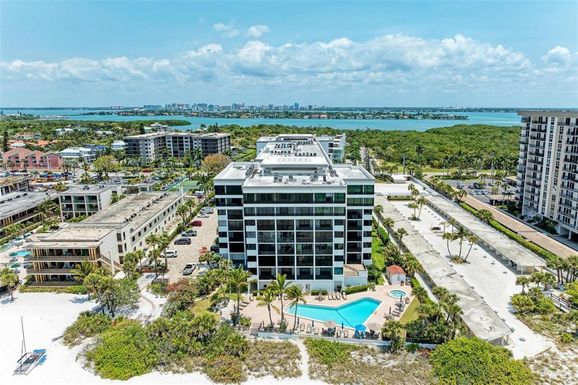
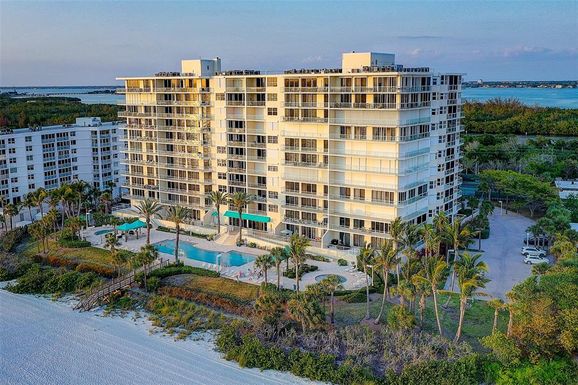
34236, FL Market Trend for Condos / Townhouses / Penthouses
Average List Price
The average list price of condos/co-ops in 34236, FL, was $2,243,117 in May 2024, compared to $1,647,666 in May 2023.
34236, FL Market Trend for Lots/Land
Average List Price
The average list price of lots/land in 34236, FL, was $3,980,529 in May 2024, compared to $2,680,870 in May 2023.
34236, FL Market Trend for Commercial
Average List Price
The average list price of commercial in 34236, FL, was $3,352,436 in May 2024, compared to $2,091,000 in May 2023.
34236, FL Housing Market Analysis
The average list price in 34236, FL is $2,698,161. The average list price in 34236, FL went up 33.08% from 2023 to 2024. 34236, FL home resale inventories is 347, which increased 100.58% since 2023. The average list price per square foot in 34236, FL is $990. 2023 it was $845.