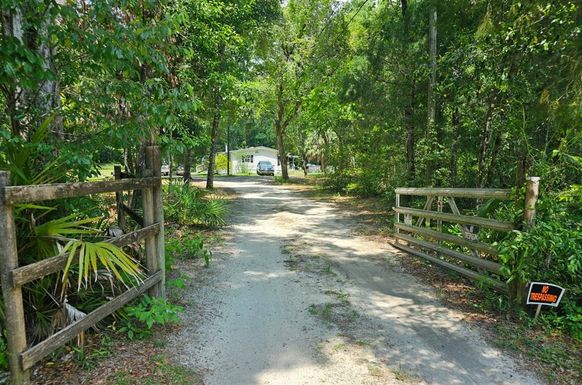
In May 2024, Chiefland, FL homes were selling for an average price of $176,523, Chiefland, FL homes on average sell after 75 days on the market compared to 89 days last year. There were 56 homes sold in Chiefland, FL for May 2024, compared to 47 last year.
The average list price of Chiefland, FL, was $133,393 in May 2024, compared to $131,533 in May 2023.
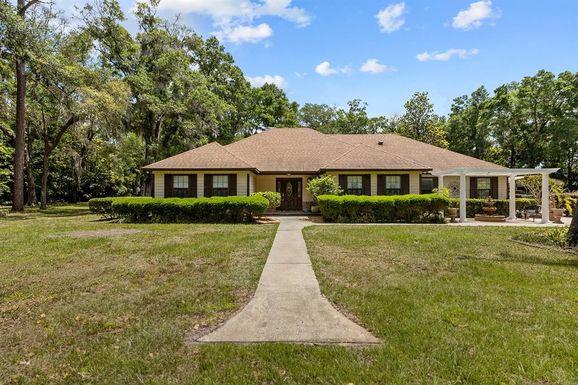
Chiefland, FL Market Trend for Houses
Average List Price
The average list price of houses in Chiefland, FL, was $418,056 in May 2024, compared to $240,967 in May 2023.
Chiefland, FL Market Trend for Condos / Townhouses / Penthouses
Average List Price
The average list price of condos/co-ops in Chiefland, FL, was $0 in May 2024, compared to $0 in May 2023.
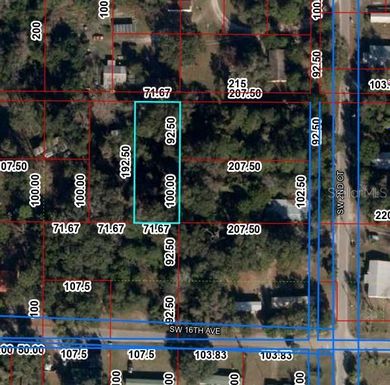
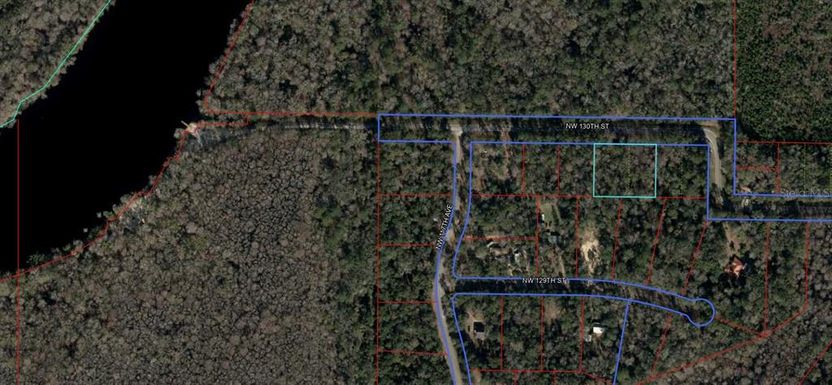
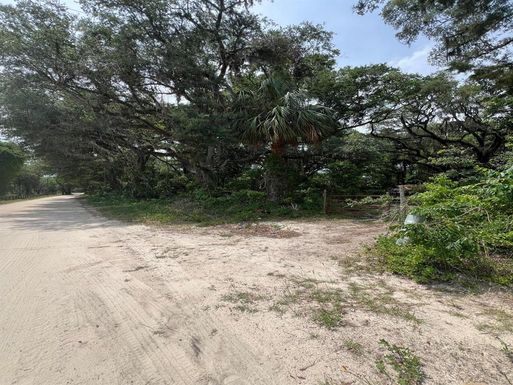
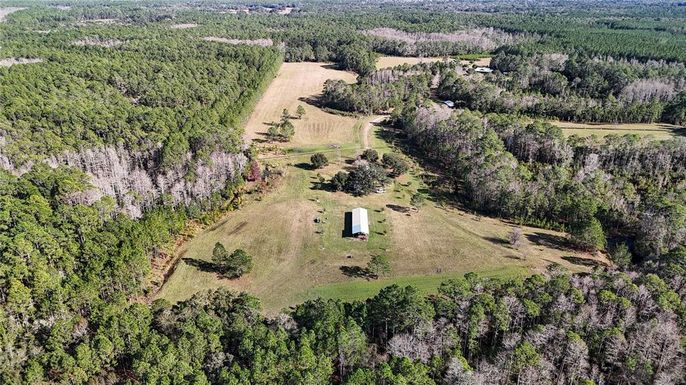
Chiefland, FL Market Trend for Lots/Land
Average List Price
The average list price of lots/land in Chiefland, FL, was $50,803 in May 2024, compared to $79,138 in May 2023.
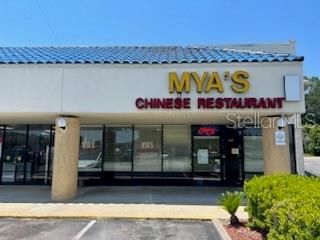
Chiefland, FL Market Trend for Commercial
Average List Price
The average list price of commercial in Chiefland, FL, was $157,000 in May 2024, compared to $91,167 in May 2023.
Chiefland, FL Housing Market Analysis
The average list price in Chiefland, FL is $133,393. The average list price in Chiefland, FL went down 1.90% from 2023 to 2024. Chiefland, FL home resale inventories is 67, which increased 157.69% since 2023. The average list price per square foot in Chiefland, FL is $199. 2023 it was $162.