In May 2024, Inglis, FL homes were selling for an average price of $222,192, Inglis, FL homes on average sell after 116 days on the market compared to 68 days last year. There were 41 homes sold in Inglis, FL for May 2024, compared to 41 last year.
The average list price of Inglis, FL, was $337,355 in May 2024, compared to $167,450 in May 2023.
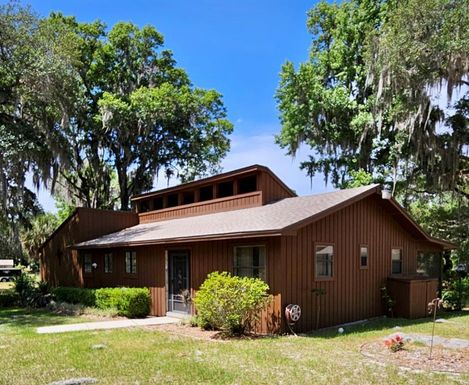
Inglis, FL Market Trend for Houses
Average List Price
The average list price of houses in Inglis, FL, was $496,510 in May 2024, compared to $243,475 in May 2023.
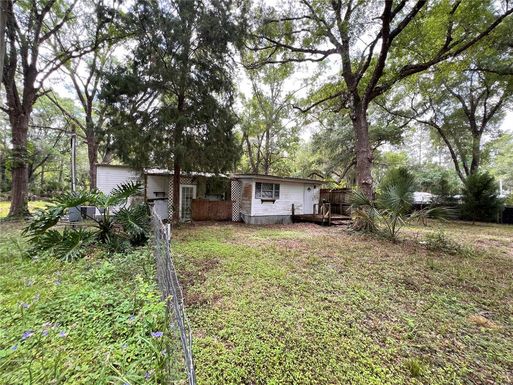
Inglis, FL Market Trend for Condos / Townhouses / Penthouses
Average List Price
The average list price of condos/co-ops in Inglis, FL, was $0 in May 2024, compared to $0 in May 2023.
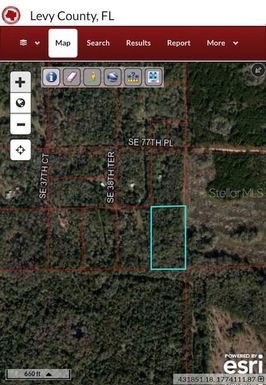
Inglis, FL Market Trend for Lots/Land
Average List Price
The average list price of lots/land in Inglis, FL, was $189,347 in May 2024, compared to $84,071 in May 2023.
Inglis, FL Market Trend for Commercial
Average List Price
The average list price of commercial in Inglis, FL, was $373,333 in May 2024, compared to $260,633 in May 2023.
Inglis, FL Housing Market Analysis
The average list price in Inglis, FL is $337,355. The average list price in Inglis, FL went up 44.19% from 2023 to 2024. Inglis, FL home resale inventories is 38, which increased 153.33% since 2023. The average list price per square foot in Inglis, FL is $270. 2023 it was $178.