In May 2024, 32110, FL homes were selling for an average price of $225,410, 32110, FL homes on average sell after 88 days on the market compared to 77 days last year. There were 296 homes sold in 32110, FL for May 2024, compared to 430 last year.
The average list price of 32110, FL, was $317,594 in May 2024, compared to $261,274 in May 2023.
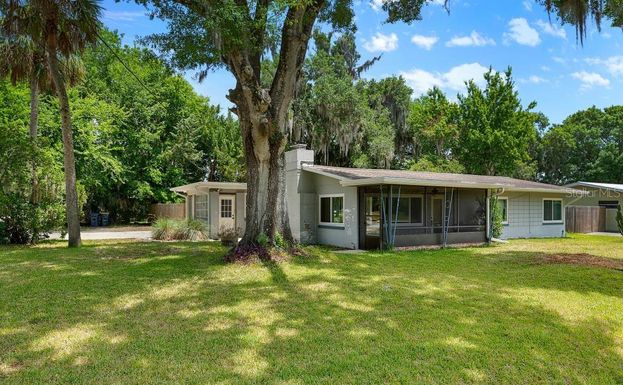
32110, FL Market Trend for Houses
Average List Price
The average list price of houses in 32110, FL, was $387,280 in May 2024, compared to $416,927 in May 2023.
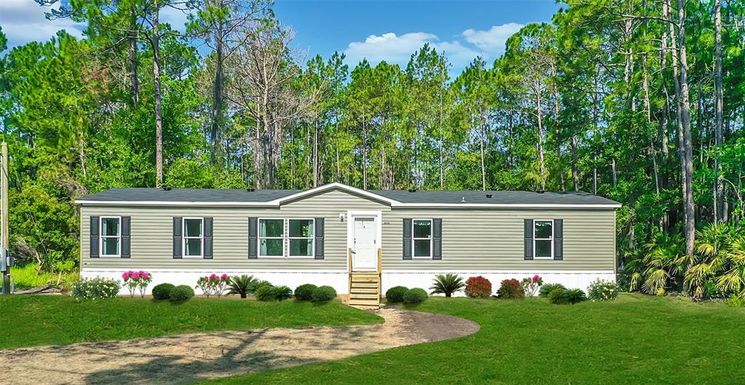
32110, FL Market Trend for Condos / Townhouses / Penthouses
Average List Price
The average list price of condos/co-ops in 32110, FL, was $167,108 in May 2024, compared to $169,900 in May 2023.
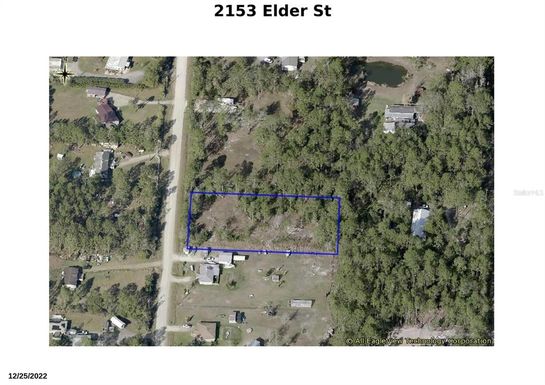
32110, FL Market Trend for Lots/Land
Average List Price
The average list price of lots/land in 32110, FL, was $163,100 in May 2024, compared to $162,429 in May 2023.
32110, FL Market Trend for Commercial
Average List Price
The average list price of commercial in 32110, FL, was $1,194,745 in May 2024, compared to $828,333 in May 2023.
32110, FL Housing Market Analysis
The average list price in 32110, FL is $317,594. The average list price in 32110, FL went up 16.52% from 2023 to 2024. 32110, FL home resale inventories is 183, which increased 69.44% since 2023. The average list price per square foot in 32110, FL is $206. 2023 it was $180.