In May 2024, 32136, FL homes were selling for an average price of $565,243, 32136, FL homes on average sell after 90 days on the market compared to 51 days last year. There were 292 homes sold in 32136, FL for May 2024, compared to 270 last year.
The average list price of 32136, FL, was $685,633 in May 2024, compared to $647,044 in May 2023.
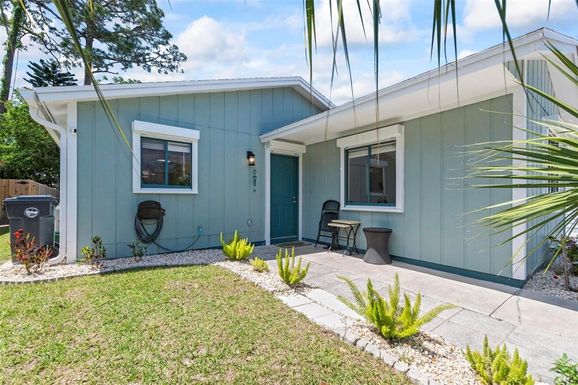
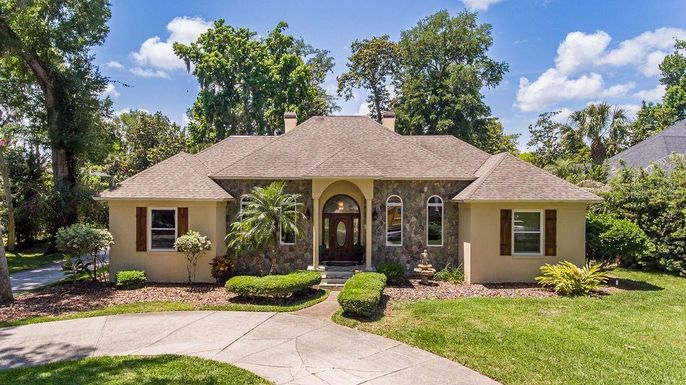
32136, FL Market Trend for Houses
Average List Price
The average list price of houses in 32136, FL, was $912,272 in May 2024, compared to $794,143 in May 2023.
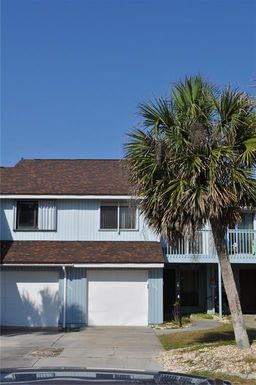
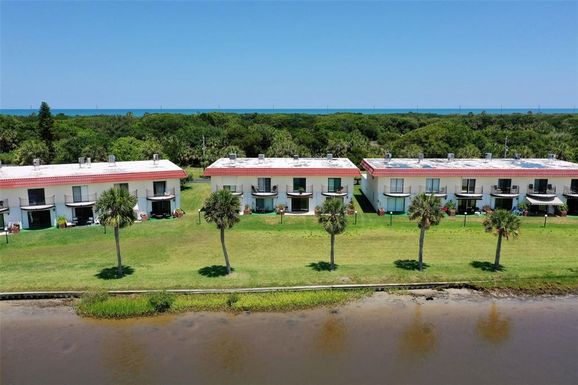
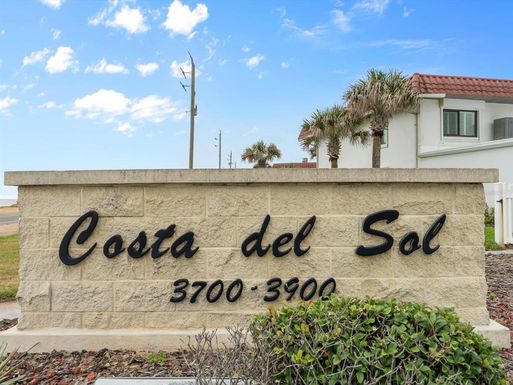
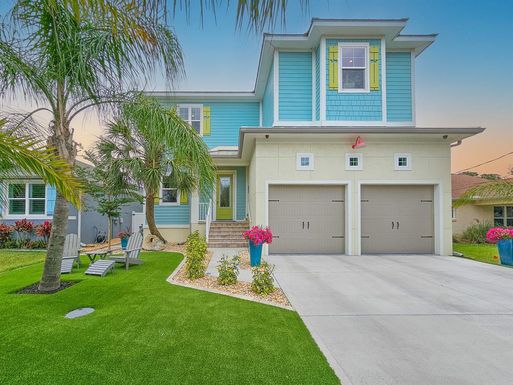
32136, FL Market Trend for Condos / Townhouses / Penthouses
Average List Price
The average list price of condos/co-ops in 32136, FL, was $417,165 in May 2024, compared to $430,453 in May 2023.
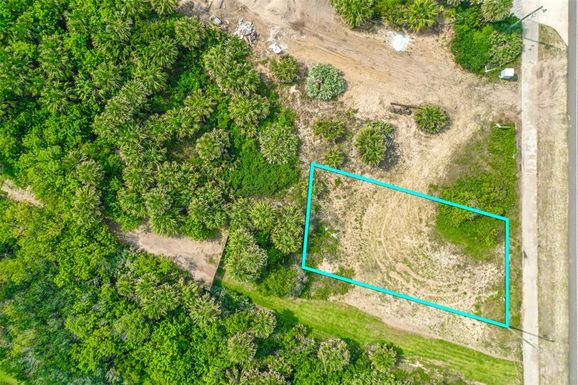
32136, FL Market Trend for Lots/Land
Average List Price
The average list price of lots/land in 32136, FL, was $422,910 in May 2024, compared to $342,700 in May 2023.
32136, FL Market Trend for Commercial
Average List Price
The average list price of commercial in 32136, FL, was $2,614,843 in May 2024, compared to $1,959,725 in May 2023.
32136, FL Housing Market Analysis
The average list price in 32136, FL is $685,633. The average list price in 32136, FL went up 6.70% from 2023 to 2024. 32136, FL home resale inventories is 209, which increased 65.87% since 2023. The average list price per square foot in 32136, FL is $366. 2023 it was $366.