In May 2024, 32119, FL homes were selling for an average price of $372,358, 32119, FL homes on average sell after 49 days on the market compared to 34 days last year. There were 178 homes sold in 32119, FL for May 2024, compared to 176 last year.
The average list price of 32119, FL, was $311,442 in May 2024, compared to $328,396 in May 2023.
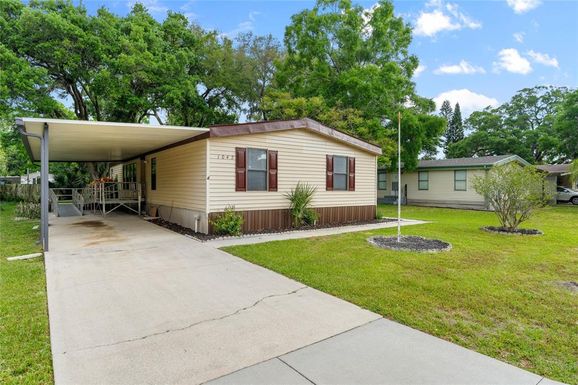
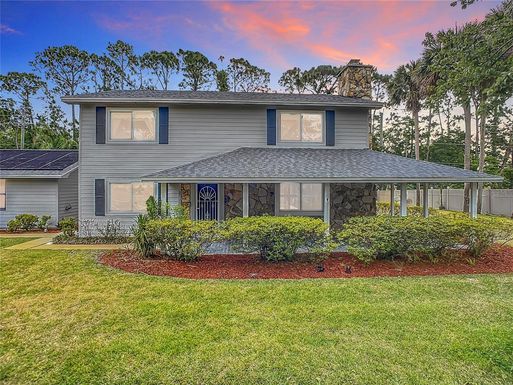
32119, FL Market Trend for Houses
Average List Price
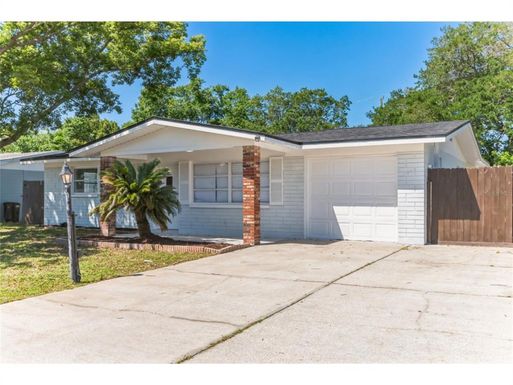
The average list price of houses in 32119, FL, was $408,426 in May 2024, compared to $362,288 in May 2023.
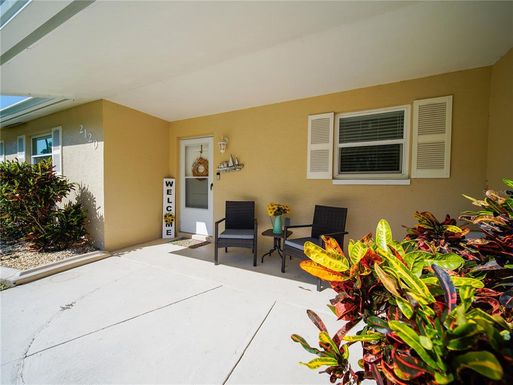
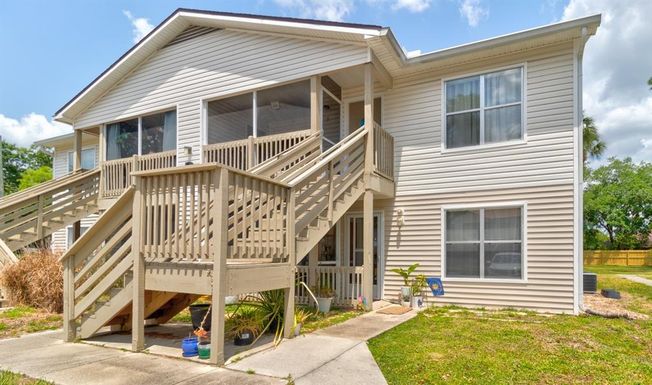
32119, FL Market Trend for Condos / Townhouses / Penthouses
Average List Price
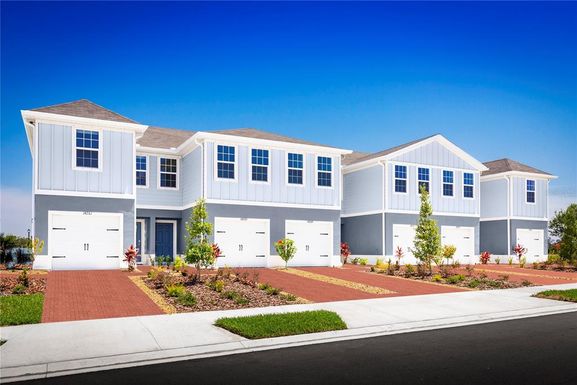
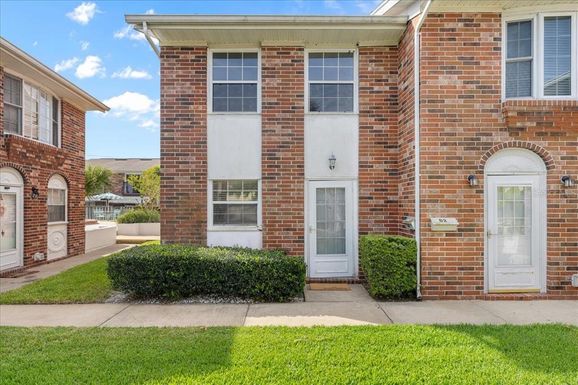
The average list price of condos/co-ops in 32119, FL, was $221,346 in May 2024, compared to $216,098 in May 2023.
32119, FL Market Trend for Lots/Land
Average List Price
The average list price of lots/land in 32119, FL, was $187,280 in May 2024, compared to $0 in May 2023.
32119, FL Market Trend for Commercial
Average List Price
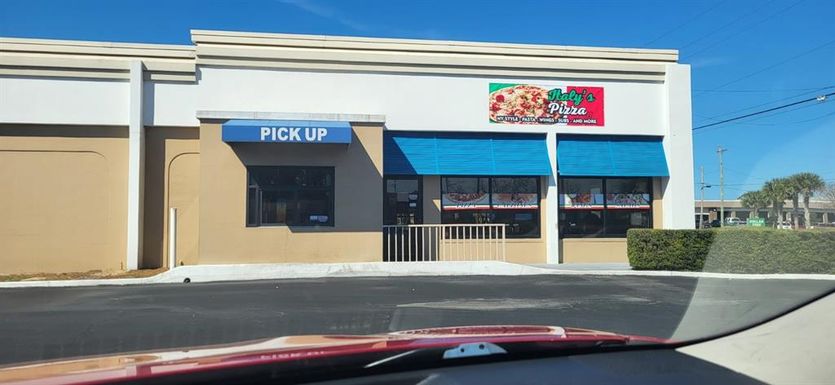
The average list price of commercial in 32119, FL, was $149,933 in May 2024, compared to $154,900 in May 2023.
32119, FL Housing Market Analysis
The average list price in 32119, FL is $311,442. The average list price in 32119, FL went down 9.05% from 2023 to 2024. 32119, FL home resale inventories is 74, which increased 138.71% since 2023. The average list price per square foot in 32119, FL is $216. 2023 it was $228.