In June 2024, 32179, FL homes were selling for an average price of $138,569, 32179, FL homes on average sell after 87 days on the market compared to 83 days last year. There were 547 homes sold in 32179, FL for June 2024, compared to 479 last year.
The average list price of 32179, FL, was $186,134 in June 2024, compared to $128,399 in June 2023.
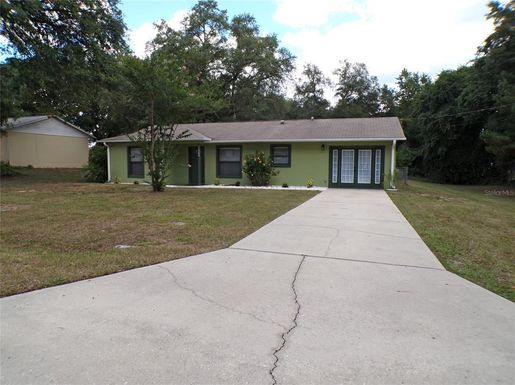
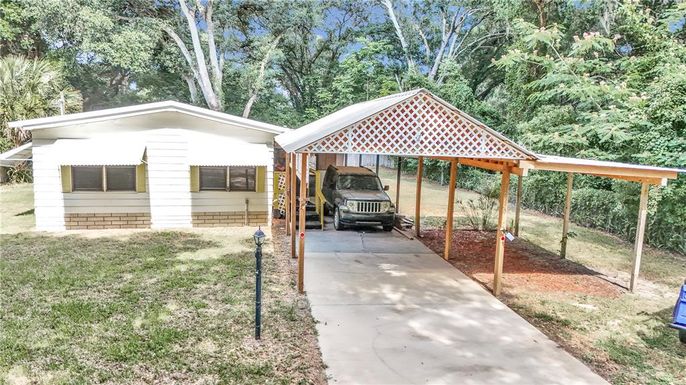
32179, FL Market Trend for Houses
Average List Price
The average list price of houses in 32179, FL, was $363,605 in June 2024, compared to $315,252 in June 2023.
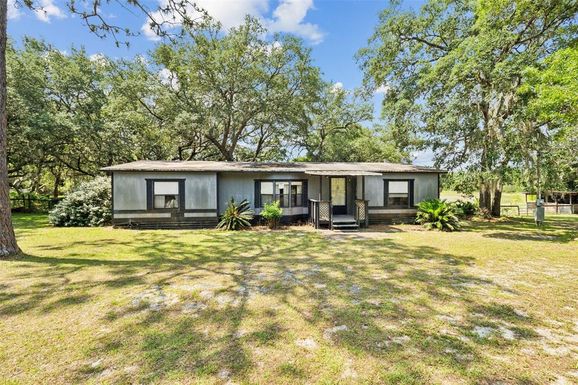
32179, FL Market Trend for Condos / Townhouses / Penthouses
Average List Price
The average list price of condos/co-ops in 32179, FL, was $0 in June 2024, compared to $0 in June 2023.
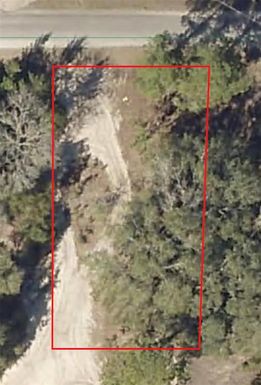
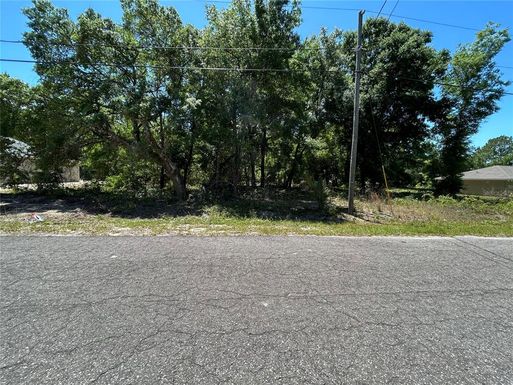
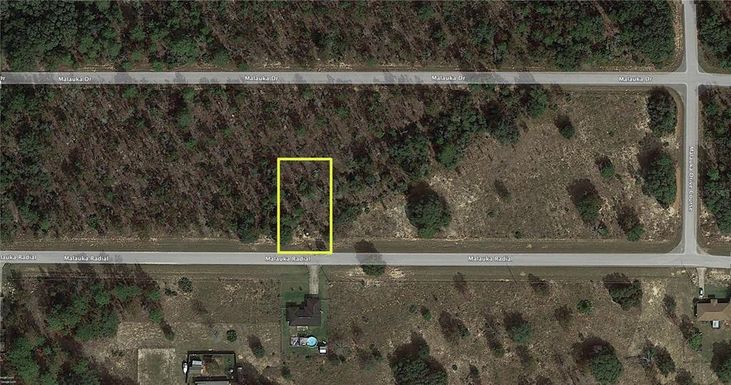
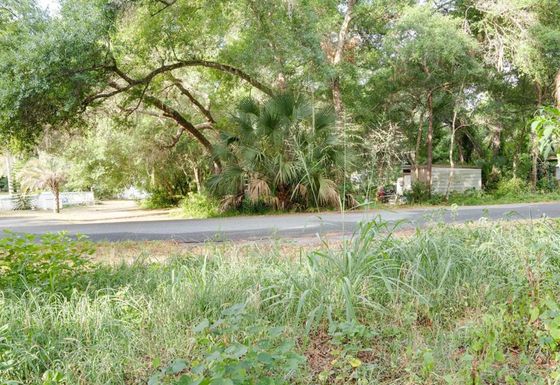
32179, FL Market Trend for Lots/Land
Average List Price
The average list price of lots/land in 32179, FL, was $82,733 in June 2024, compared to $34,237 in June 2023.
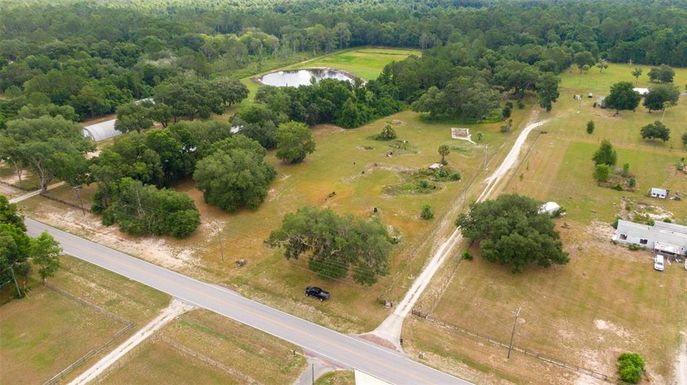
32179, FL Market Trend for Commercial
Average List Price
The average list price of commercial in 32179, FL, was $147,944 in June 2024, compared to $23,700 in June 2023.
32179, FL Housing Market Analysis
The average list price in 32179, FL is $186,134. The average list price in 32179, FL went up 53.76% from 2023 to 2024. 32179, FL home resale inventories is 291, which increased 36.62% since 2023. The average list price per square foot in 32179, FL is $198. 2023 it was $189.