In June 2024, 32640, FL homes were selling for an average price of $217,264, 32640, FL homes on average sell after 65 days on the market compared to 669 days last year. There were 14 homes sold in 32640, FL for June 2024, compared to 7 last year.
The average list price of 32640, FL, was $222,485 in June 2024, compared to $17,870 in June 2023.
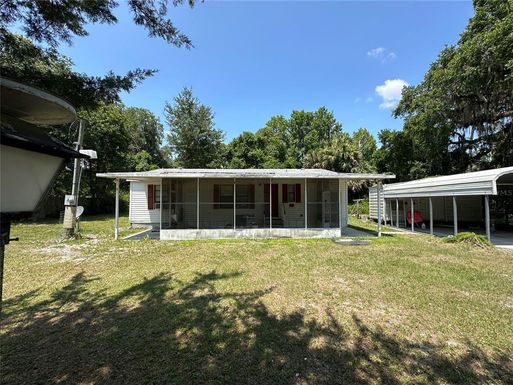
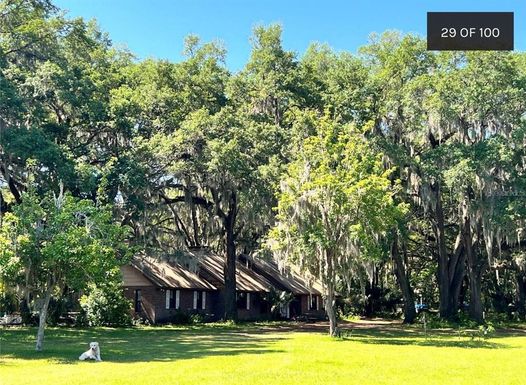
32640, FL Market Trend for Houses
Average List Price
The average list price of houses in 32640, FL, was $443,860 in June 2024, compared to $0 in June 2023.
32640, FL Market Trend for Condos / Townhouses / Penthouses
Average List Price
The average list price of condos/co-ops in 32640, FL, was $0 in June 2024, compared to $0 in June 2023.
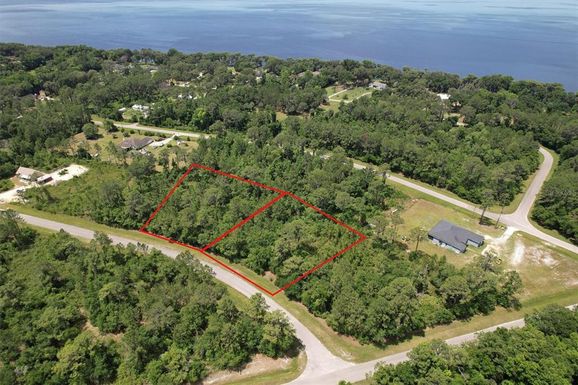
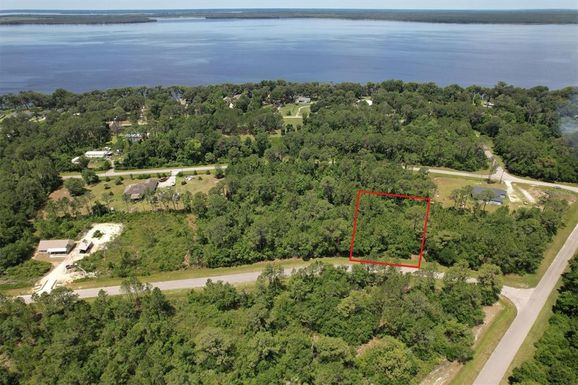
32640, FL Market Trend for Lots/Land
Average List Price
The average list price of lots/land in 32640, FL, was $51,996 in June 2024, compared to $18,756 in June 2023.
32640, FL Market Trend for Commercial
Average List Price
The average list price of commercial in 32640, FL, was $516,560 in June 2024, compared to $9,900 in June 2023.
32640, FL Housing Market Analysis
The average list price in 32640, FL is $222,485. The average list price in 32640, FL went up 342.00% from 2023 to 2024. 32640, FL home resale inventories is 88, which increased 700.00% since 2023. The average list price per square foot in 32640, FL is $223. 2023 it was $201.