In May 2024, 32641, FL homes were selling for an average price of $191,015, 32641, FL homes on average sell after 54 days on the market compared to 36 days last year. There were 161 homes sold in 32641, FL for May 2024, compared to 151 last year.
The average list price of 32641, FL, was $345,192 in May 2024, compared to $289,531 in May 2023.
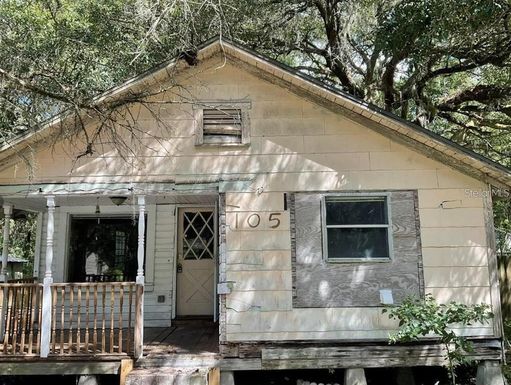
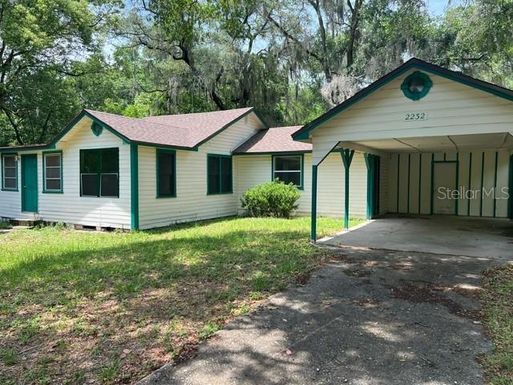
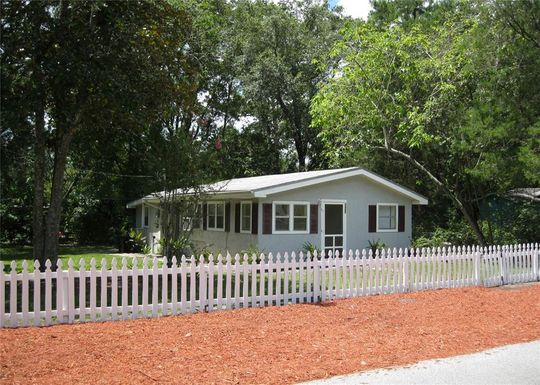
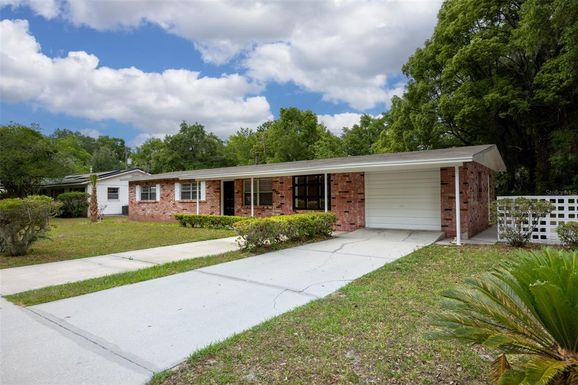
32641, FL Market Trend for Houses
Average List Price
The average list price of houses in 32641, FL, was $230,651 in May 2024, compared to $232,731 in May 2023.
32641, FL Market Trend for Condos / Townhouses / Penthouses
Average List Price
The average list price of condos/co-ops in 32641, FL, was $0 in May 2024, compared to $0 in May 2023.
32641, FL Market Trend for Lots/Land
Average List Price
The average list price of lots/land in 32641, FL, was $302,306 in May 2024, compared to $608,857 in May 2023.
32641, FL Market Trend for Commercial
Average List Price
The average list price of commercial in 32641, FL, was $1,279,998 in May 2024, compared to $20,000 in May 2023.
32641, FL Housing Market Analysis
The average list price in 32641, FL is $345,192. The average list price in 32641, FL went up 20.75% from 2023 to 2024. 32641, FL home resale inventories is 47, which increased 11.90% since 2023. The average list price per square foot in 32641, FL is $166. 2023 it was $169.