In June 2024, 32835, FL homes were selling for an average price of $398,370, 32835, FL homes on average sell after 42 days on the market compared to 50 days last year. There were 55 homes sold in 32835, FL for June 2024, compared to 9 last year.
The average list price of 32835, FL, was $379,240 in June 2024, compared to $50,000 in June 2023.
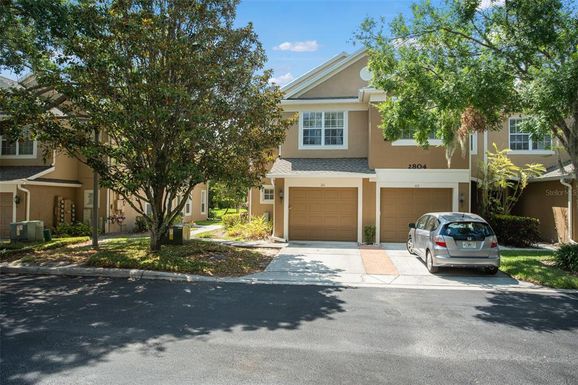
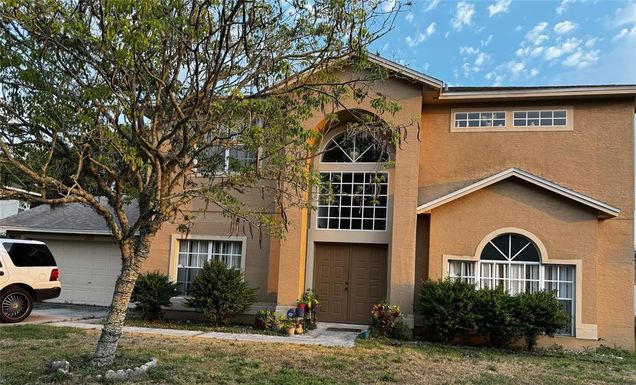
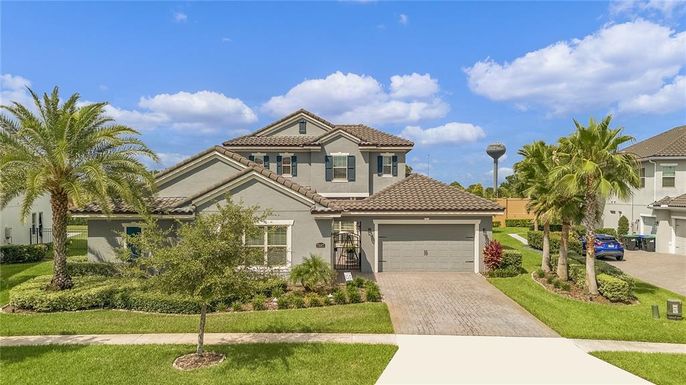
32835, FL Market Trend for Houses
Average List Price
The average list price of houses in 32835, FL, was $654,236 in June 2024, compared to $0 in June 2023.
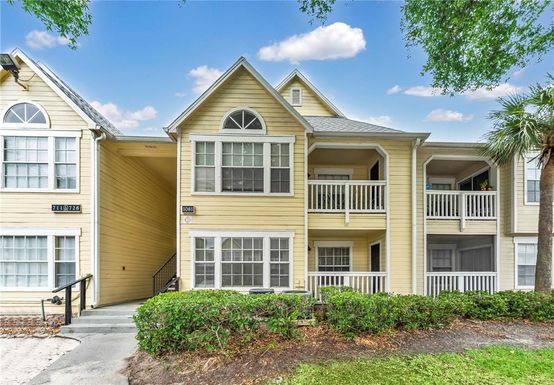
32835, FL Market Trend for Condos / Townhouses / Penthouses
Average List Price
The average list price of condos/co-ops in 32835, FL, was $256,685 in June 2024, compared to $0 in June 2023.
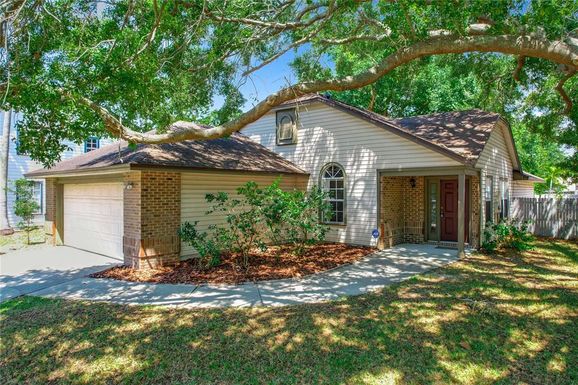
32835, FL Market Trend for Lots/Land
Average List Price
The average list price of lots/land in 32835, FL, was $129,800 in June 2024, compared to $50,000 in June 2023.
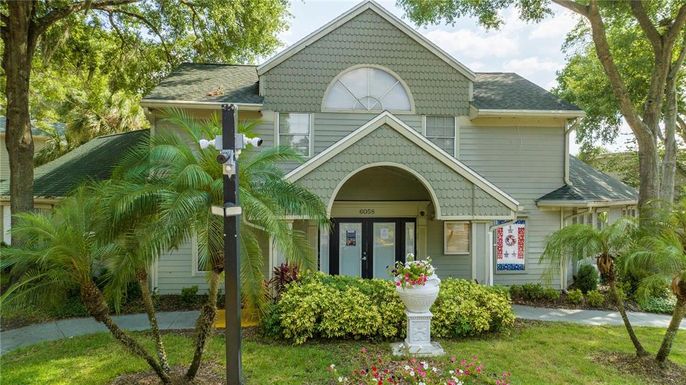
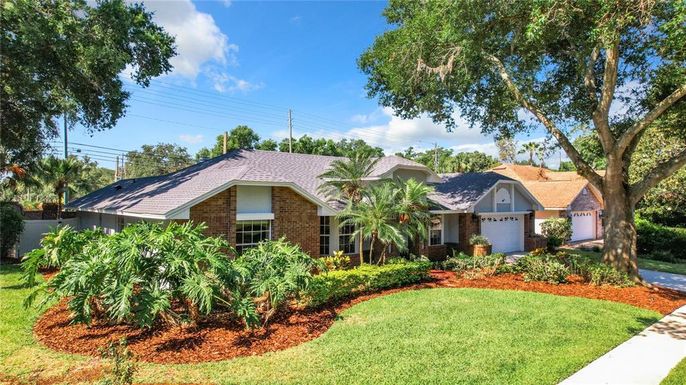
32835, FL Market Trend for Commercial
Average List Price
The average list price of commercial in 32835, FL, was $340,150 in June 2024, compared to $0 in June 2023.
32835, FL Housing Market Analysis
The average list price in 32835, FL is $379,240. The average list price in 32835, FL went up 196.67% from 2023 to 2024. 32835, FL home resale inventories is 129, which increased 2050.00% since 2023. The average list price per square foot in 32835, FL is $228. 2023 it was $205.