In June 2024, 32839, FL homes were selling for an average price of $270,614, 32839, FL homes on average sell after 36 days on the market compared to 33 days last year. There were 305 homes sold in 32839, FL for June 2024, compared to 358 last year.
The average list price of 32839, FL, was $309,763 in June 2024, compared to $285,131 in June 2023.
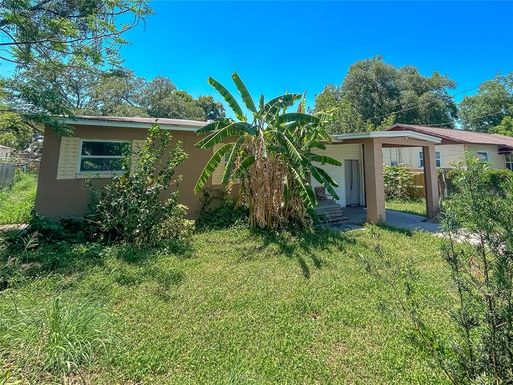
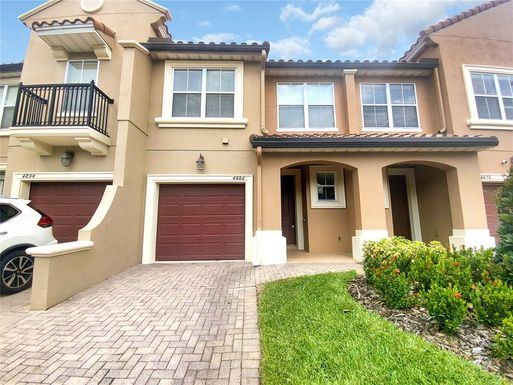
32839, FL Market Trend for Houses
Average List Price
The average list price of houses in 32839, FL, was $592,771 in June 2024, compared to $349,000 in June 2023.
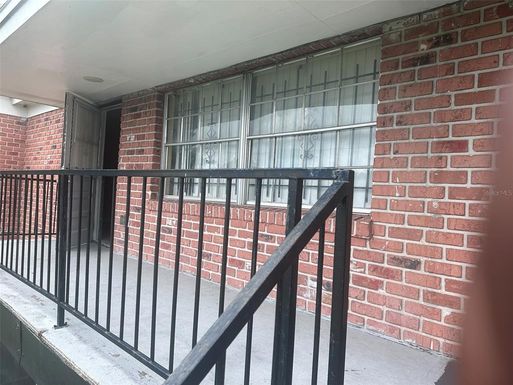
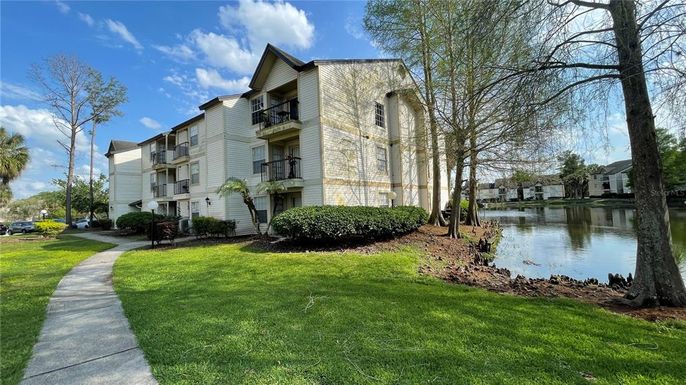
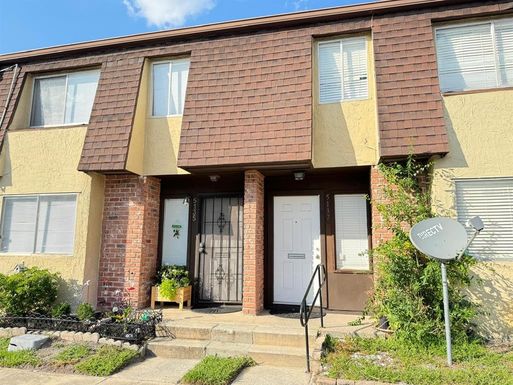
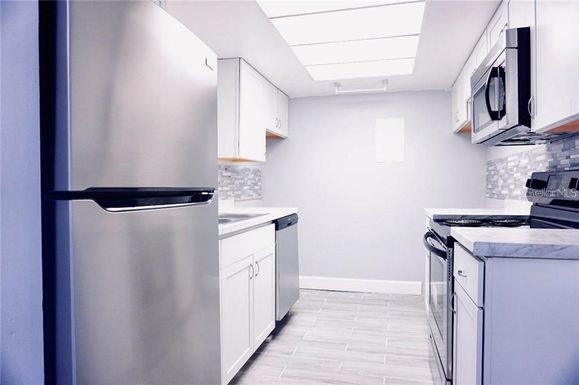
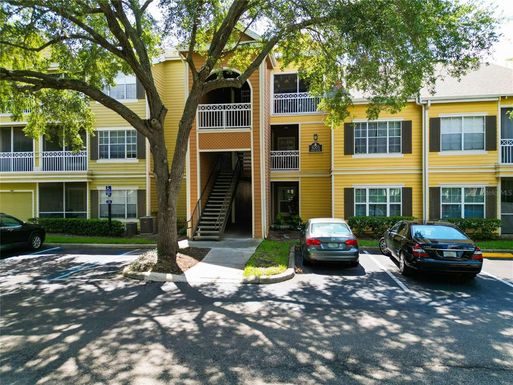
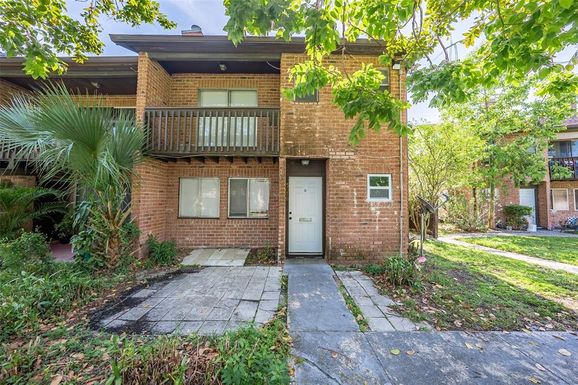
32839, FL Market Trend for Condos / Townhouses / Penthouses
Average List Price
The average list price of condos/co-ops in 32839, FL, was $186,932 in June 2024, compared to $188,966 in June 2023.
32839, FL Market Trend for Lots/Land
Average List Price
The average list price of lots/land in 32839, FL, was $439,571 in June 2024, compared to $267,000 in June 2023.
32839, FL Market Trend for Commercial
Average List Price
The average list price of commercial in 32839, FL, was $978,640 in June 2024, compared to $1,315,000 in June 2023.
32839, FL Housing Market Analysis
The average list price in 32839, FL is $309,763. The average list price in 32839, FL went up 5.76% from 2023 to 2024. 32839, FL home resale inventories is 139, which increased 110.61% since 2023. The average list price per square foot in 32839, FL is $206. 2023 it was $191.