In June 2024, 33909, FL homes were selling for an average price of $202,034, 33909, FL homes on average sell after 100 days on the market compared to 73 days last year. There were 240 homes sold in 33909, FL for June 2024, compared to 122 last year.
The average list price of 33909, FL, was $211,445 in June 2024, compared to $149,332 in June 2023.
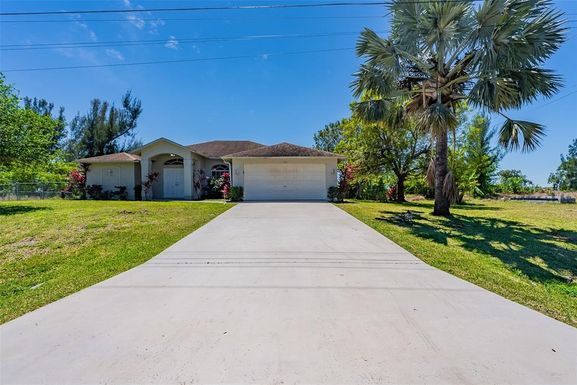
33909, FL Market Trend for Houses
Average List Price
The average list price of houses in 33909, FL, was $428,604 in June 2024, compared to $408,695 in June 2023.
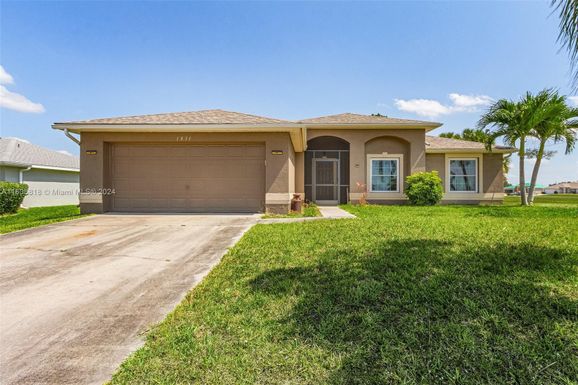
33909, FL Market Trend for Condos / Townhouses / Penthouses
Average List Price
The average list price of condos/co-ops in 33909, FL, was $253,348 in June 2024, compared to $0 in June 2023.
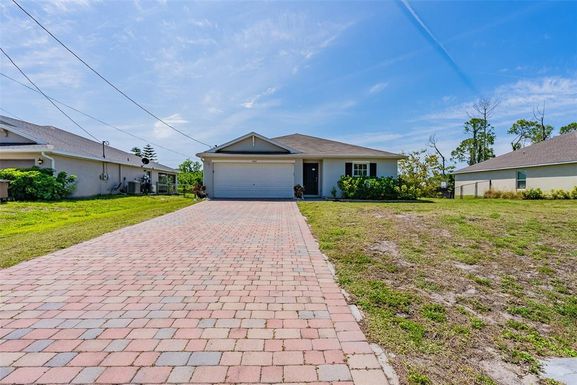
33909, FL Market Trend for Lots/Land
Average List Price
The average list price of lots/land in 33909, FL, was $70,505 in June 2024, compared to $57,718 in June 2023.
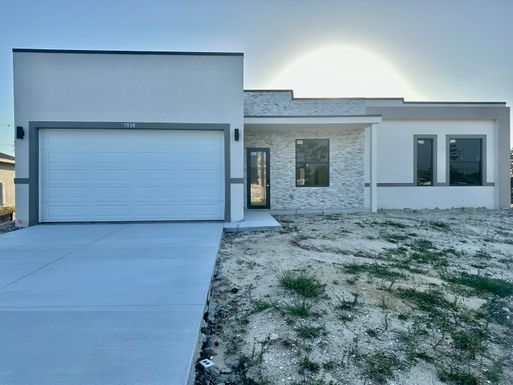
33909, FL Market Trend for Commercial
Average List Price
The average list price of commercial in 33909, FL, was $149,345 in June 2024, compared to $51,033 in June 2023.
33909, FL Housing Market Analysis
The average list price in 33909, FL is $211,445. The average list price in 33909, FL went up 38.90% from 2023 to 2024. 33909, FL home resale inventories is 211, which increased 99.06% since 2023. The average list price per square foot in 33909, FL is $235. 2023 it was $227.