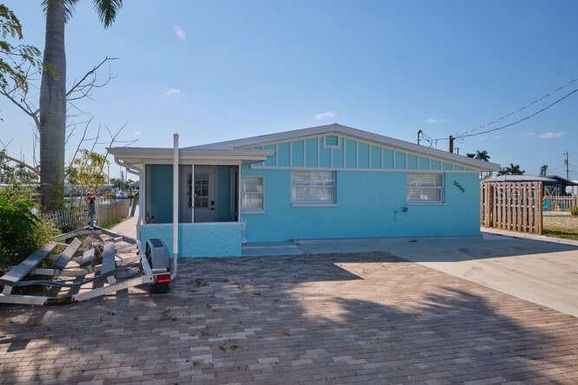
In June 2024, 33993, FL homes were selling for an average price of $247,011, 33993, FL homes on average sell after 100 days on the market compared to 78 days last year. There were 321 homes sold in 33993, FL for June 2024, compared to 223 last year.
The average list price of 33993, FL, was $286,455 in June 2024, compared to $245,228 in June 2023.
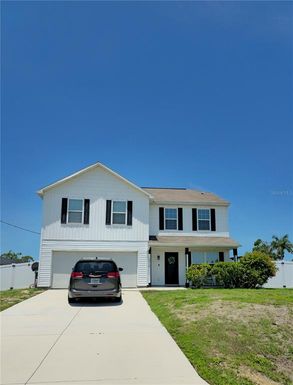
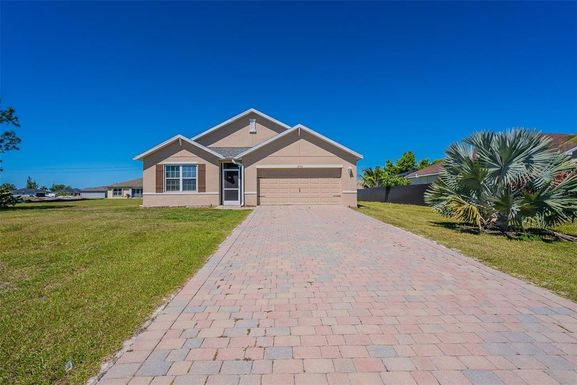
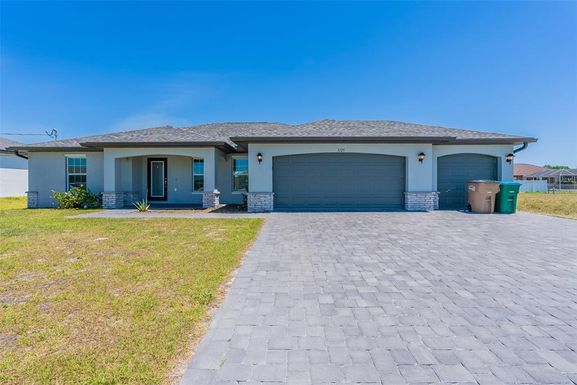
33993, FL Market Trend for Houses
Average List Price
The average list price of houses in 33993, FL, was $550,263 in June 2024, compared to $588,925 in June 2023.
33993, FL Market Trend for Condos / Townhouses / Penthouses
Average List Price
The average list price of condos/co-ops in 33993, FL, was $0 in June 2024, compared to $0 in June 2023.
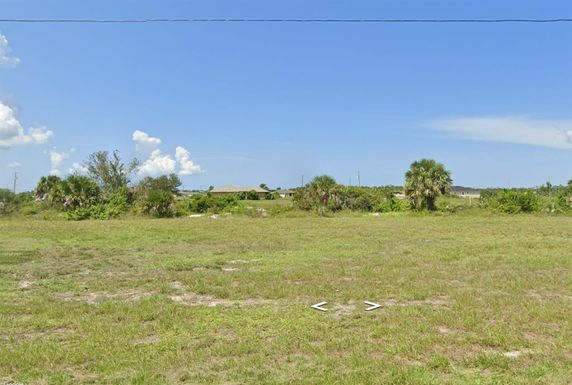
33993, FL Market Trend for Lots/Land
Average List Price
The average list price of lots/land in 33993, FL, was $100,094 in June 2024, compared to $77,558 in June 2023.
33993, FL Market Trend for Commercial
Average List Price
The average list price of commercial in 33993, FL, was $206,989 in June 2024, compared to $114,933 in June 2023.
33993, FL Housing Market Analysis
The average list price in 33993, FL is $286,455. The average list price in 33993, FL went up 19.75% from 2023 to 2024. 33993, FL home resale inventories is 337, which increased 171.77% since 2023. The average list price per square foot in 33993, FL is $279. 2023 it was $310.