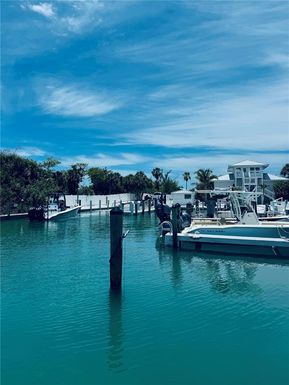
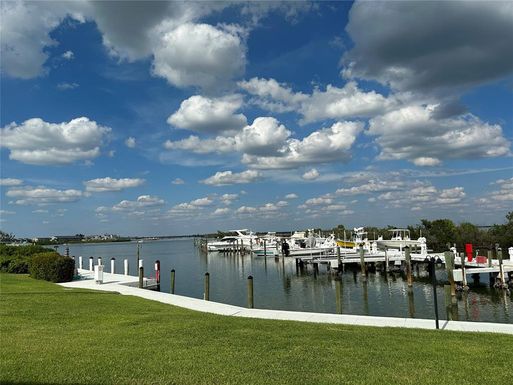
In June 2024, 33921, FL homes were selling for an average price of $3,598,650, 33921, FL homes on average sell after 71 days on the market compared to 63 days last year. There were 70 homes sold in 33921, FL for June 2024, compared to 52 last year.
The average list price of 33921, FL, was $4,564,242 in June 2024, compared to $3,731,657 in June 2023.
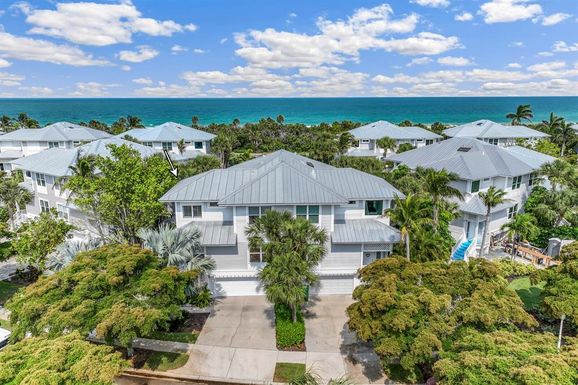
33921, FL Market Trend for Houses
Average List Price
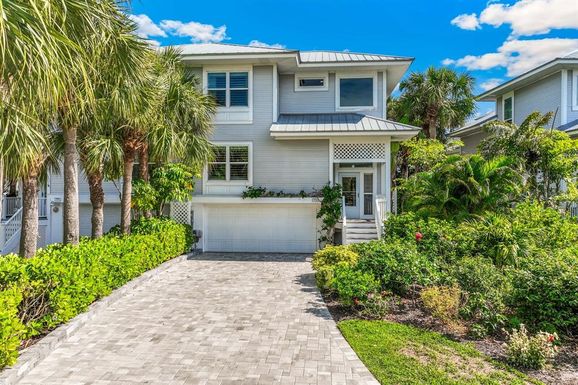
The average list price of houses in 33921, FL, was $7,560,103 in June 2024, compared to $5,129,158 in June 2023.
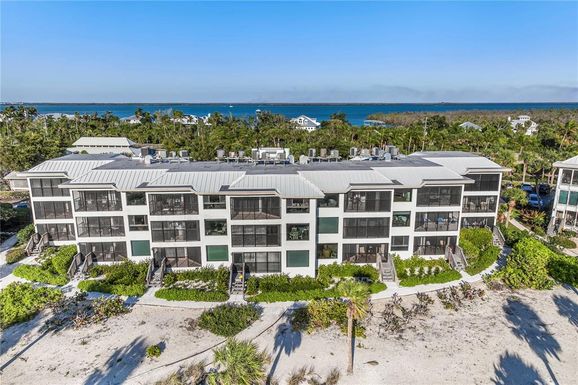
33921, FL Market Trend for Condos / Townhouses / Penthouses
Average List Price
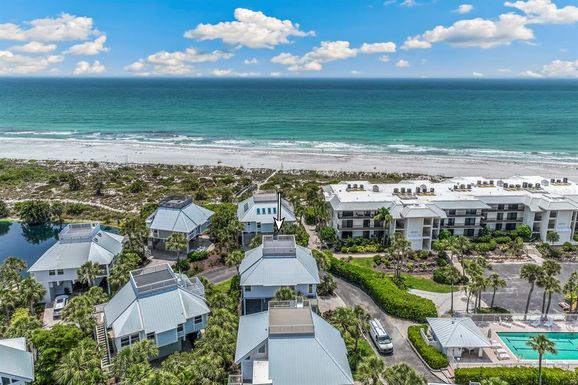
The average list price of condos/co-ops in 33921, FL, was $2,292,895 in June 2024, compared to $2,599,889 in June 2023.
33921, FL Market Trend for Lots/Land
Average List Price
The average list price of lots/land in 33921, FL, was $4,879,000 in June 2024, compared to $2,958,333 in June 2023.
33921, FL Market Trend for Commercial
Average List Price
The average list price of commercial in 33921, FL, was $2,500,000 in June 2024, compared to $0 in June 2023.
33921, FL Housing Market Analysis
The average list price in 33921, FL is $4,564,242. The average list price in 33921, FL went up 17.95% from 2023 to 2024. 33921, FL home resale inventories is 90, which increased 181.25% since 2023. The average list price per square foot in 33921, FL is $1,759. 2023 it was $1,753.