In May 2024, 33931, FL homes were selling for an average price of $695,067, 33931, FL homes on average sell after 132 days on the market compared to 55 days last year. There were 6 homes sold in 33931, FL for May 2024, compared to 9 last year.
The average list price of 33931, FL, was $1,195,975 in May 2024, compared to $368,000 in May 2023.
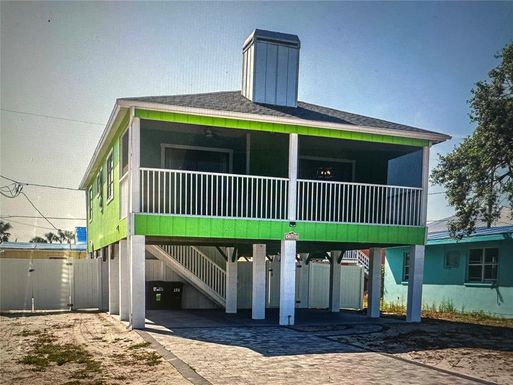
33931, FL Market Trend for Houses
Average List Price
The average list price of houses in 33931, FL, was $1,351,580 in May 2024, compared to $597,000 in May 2023.
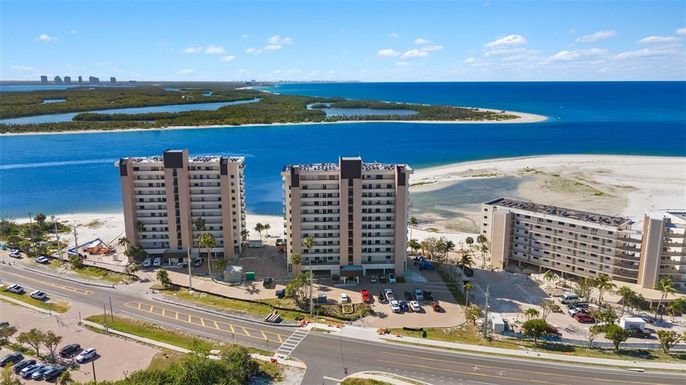
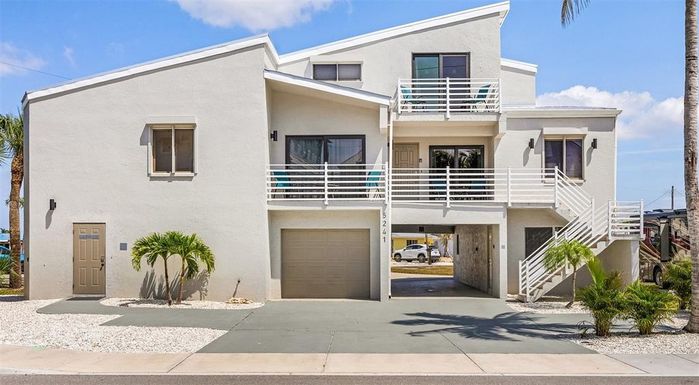
33931, FL Market Trend for Condos / Townhouses / Penthouses
Average List Price
The average list price of condos/co-ops in 33931, FL, was $642,450 in May 2024, compared to $0 in May 2023.
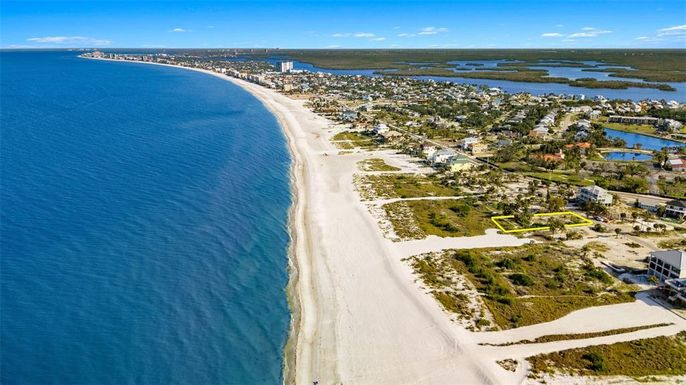
33931, FL Market Trend for Lots/Land
Average List Price
The average list price of lots/land in 33931, FL, was $1,234,700 in May 2024, compared to $139,000 in May 2023.
33931, FL Market Trend for Commercial
Average List Price
The average list price of commercial in 33931, FL, was $0 in May 2024, compared to $0 in May 2023.
33931, FL Housing Market Analysis
The average list price in 33931, FL is $1,195,975. The average list price in 33931, FL went up 224.99% from 2023 to 2024. 33931, FL home resale inventories is 16, which increased 700.00% since 2023. The average list price per square foot in 33931, FL is $596. 2023 it was $548.