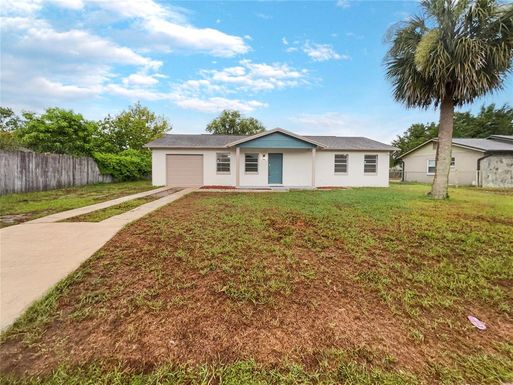
In June 2024, 34743, FL homes were selling for an average price of $360,110, 34743, FL homes on average sell after 32 days on the market compared to 28 days last year. There were 354 homes sold in 34743, FL for June 2024, compared to 439 last year.
The average list price of 34743, FL, was $435,756 in June 2024, compared to $346,027 in June 2023.
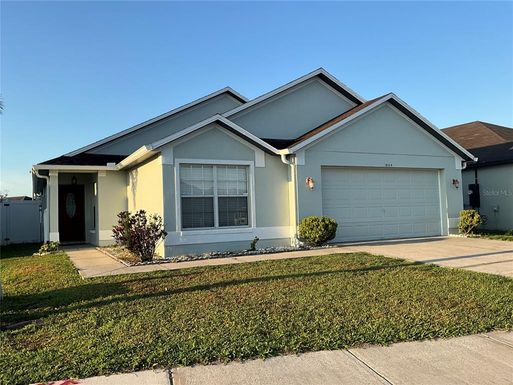
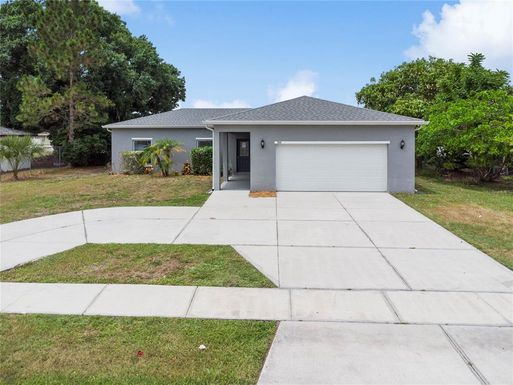
34743, FL Market Trend for Houses
Average List Price
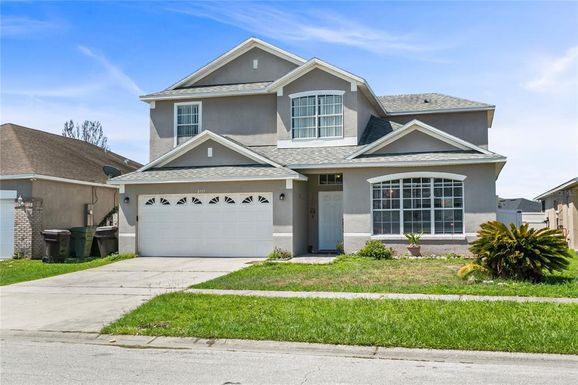
The average list price of houses in 34743, FL, was $393,775 in June 2024, compared to $369,666 in June 2023.
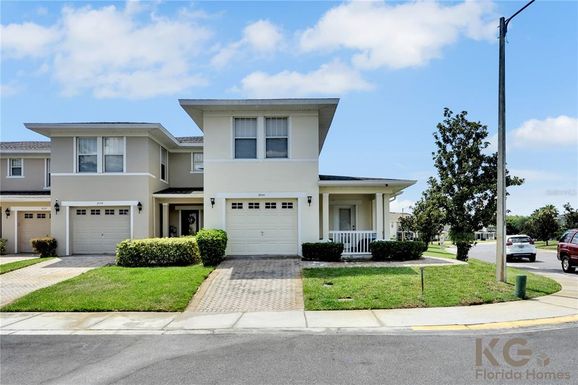
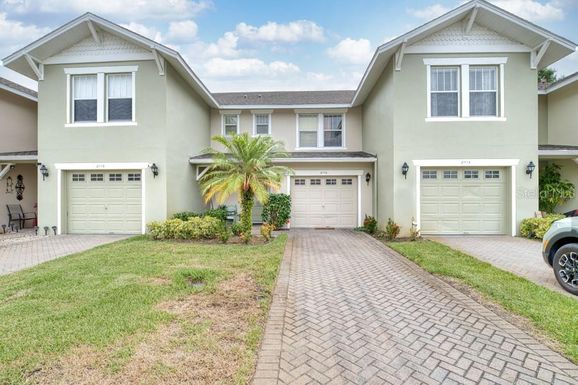
34743, FL Market Trend for Condos / Townhouses / Penthouses
Average List Price
The average list price of condos/co-ops in 34743, FL, was $320,219 in June 2024, compared to $275,081 in June 2023.
34743, FL Market Trend for Lots/Land
Average List Price
The average list price of lots/land in 34743, FL, was $2,200,000 in June 2024, compared to $0 in June 2023.
34743, FL Market Trend for Commercial
Average List Price
The average list price of commercial in 34743, FL, was $995,000 in June 2024, compared to $199,900 in June 2023.
34743, FL Housing Market Analysis
The average list price in 34743, FL is $435,756. The average list price in 34743, FL went up 24.32% from 2023 to 2024. 34743, FL home resale inventories is 91, which increased 35.82% since 2023. The average list price per square foot in 34743, FL is $242. 2023 it was $229.