In May 2024, Deland, FL homes were selling for an average price of $351,621, Deland, FL homes on average sell after 61 days on the market compared to 53 days last year. There were 1630 homes sold in Deland, FL for May 2024, compared to 1793 last year.
The average list price of Deland, FL, was $383,073 in May 2024, compared to $401,651 in May 2023.
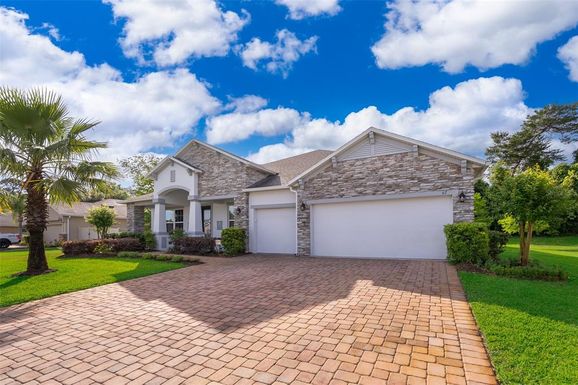
Deland, FL Market Trend for Houses
Average List Price
The average list price of houses in Deland, FL, was $424,096 in May 2024, compared to $408,558 in May 2023.
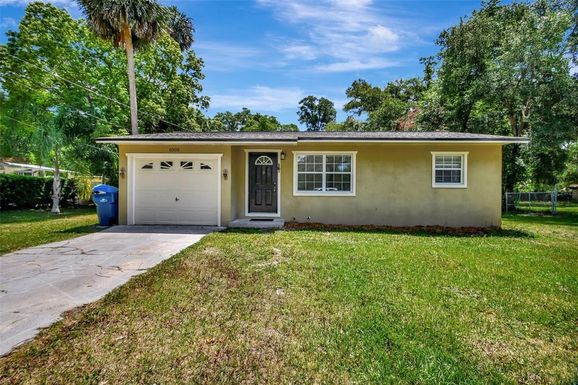
Deland, FL Market Trend for Condos / Townhouses / Penthouses
Average List Price
The average list price of condos/co-ops in Deland, FL, was $228,932 in May 2024, compared to $220,744 in May 2023.
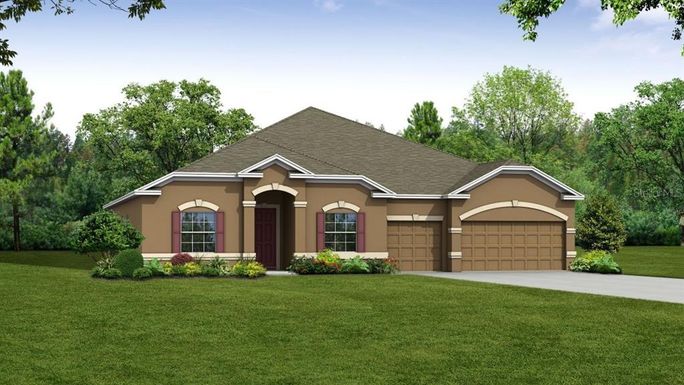
Deland, FL Market Trend for Lots/Land
Average List Price
The average list price of lots/land in Deland, FL, was $260,086 in May 2024, compared to $422,772 in May 2023.
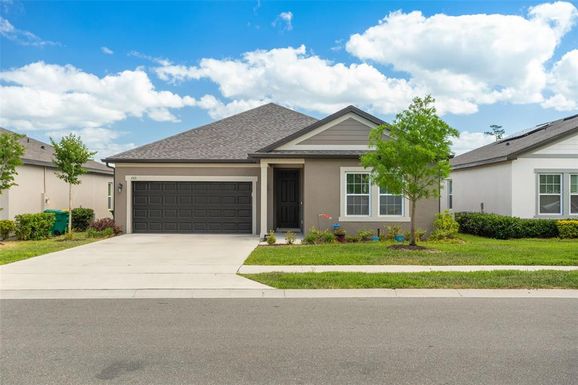
Deland, FL Market Trend for Commercial
Average List Price
The average list price of commercial in Deland, FL, was $714,999 in May 2024, compared to $659,882 in May 2023.
Deland, FL Housing Market Analysis
The average list price in Deland, FL is $383,073. The average list price in Deland, FL went up 0.68% from 2023 to 2024. Deland, FL home resale inventories is 533, which increased 9.90% since 2023. The average list price per square foot in Deland, FL is $215. 2023 it was $200.