In May 2024, Sebring, FL homes were selling for an average price of $157,840, Sebring, FL homes on average sell after 94 days on the market compared to 77 days last year. There were 505 homes sold in Sebring, FL for May 2024, compared to 409 last year.
The average list price of Sebring, FL, was $184,615 in May 2024, compared to $135,352 in May 2023.
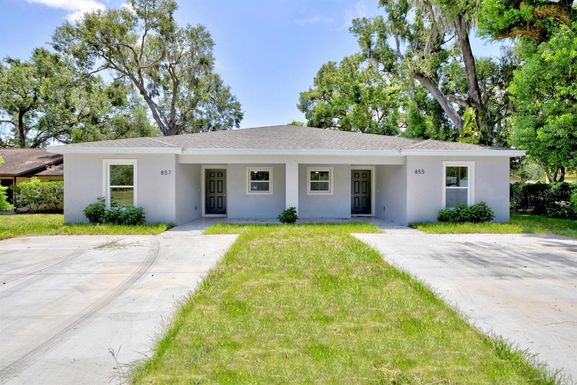
Sebring, FL Market Trend for Houses
Average List Price
The average list price of houses in Sebring, FL, was $352,901 in May 2024, compared to $323,907 in May 2023.
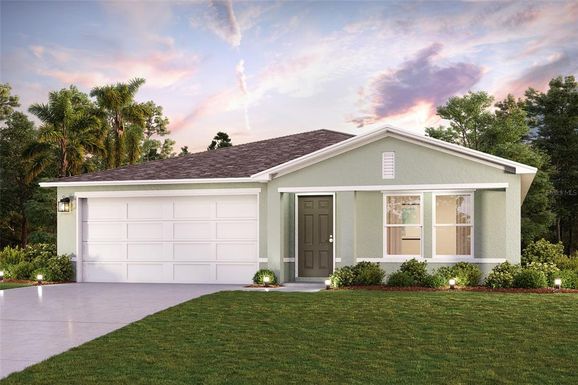
Sebring, FL Market Trend for Condos / Townhouses / Penthouses
Average List Price
The average list price of condos/co-ops in Sebring, FL, was $201,038 in May 2024, compared to $94,900 in May 2023.
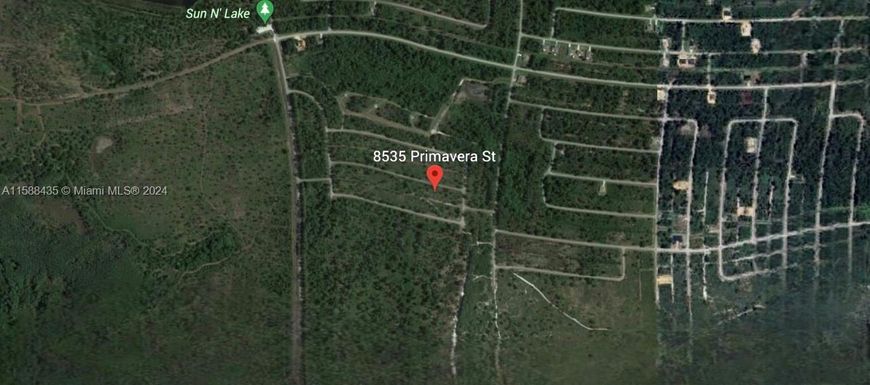
Sebring, FL Market Trend for Lots/Land
Average List Price
The average list price of lots/land in Sebring, FL, was $95,462 in May 2024, compared to $42,599 in May 2023.
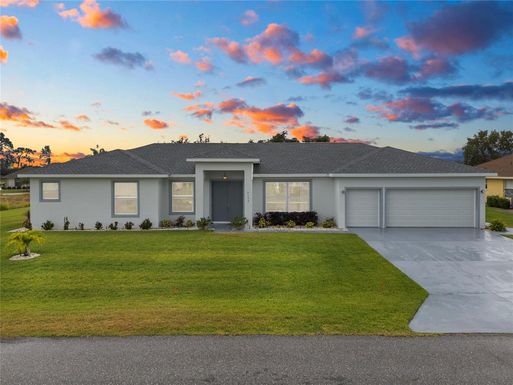
Sebring, FL Market Trend for Commercial
Average List Price
The average list price of commercial in Sebring, FL, was $132,802 in May 2024, compared to $158,885 in May 2023.
Sebring, FL Housing Market Analysis
The average list price in Sebring, FL is $184,615. The average list price in Sebring, FL went up 20.92% from 2023 to 2024. Sebring, FL home resale inventories is 511, which increased 162.05% since 2023. The average list price per square foot in Sebring, FL is $184. 2023 it was $230.