In June 2024, 33843, FL homes were selling for an average price of $186,741, 33843, FL homes on average sell after 103 days on the market compared to 84 days last year. There were 267 homes sold in 33843, FL for June 2024, compared to 241 last year.
The average list price of 33843, FL, was $274,400 in June 2024, compared to $176,766 in June 2023.
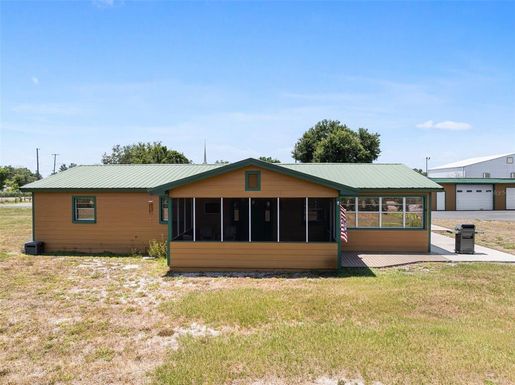
33843, FL Market Trend for Houses
Average List Price
The average list price of houses in 33843, FL, was $310,164 in June 2024, compared to $278,069 in June 2023.
33843, FL Market Trend for Condos / Townhouses / Penthouses
Average List Price
The average list price of condos/co-ops in 33843, FL, was $0 in June 2024, compared to $0 in June 2023.
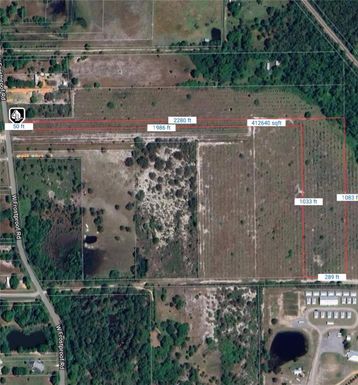
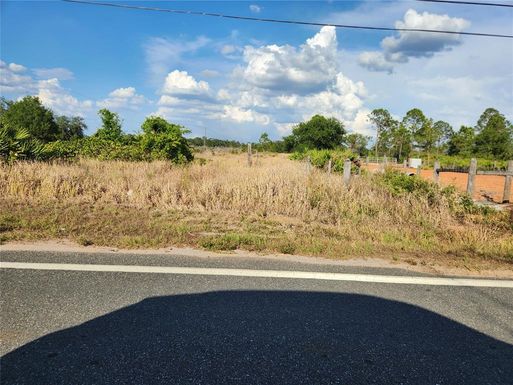
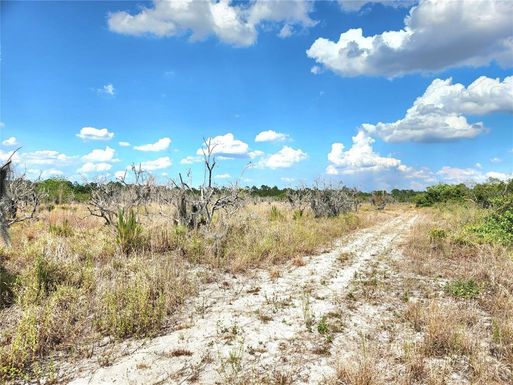
33843, FL Market Trend for Lots/Land
Average List Price
The average list price of lots/land in 33843, FL, was $266,346 in June 2024, compared to $125,826 in June 2023.
33843, FL Market Trend for Commercial
Average List Price
The average list price of commercial in 33843, FL, was $295,121 in June 2024, compared to $220,335 in June 2023.
33843, FL Housing Market Analysis
The average list price in 33843, FL is $274,400. The average list price in 33843, FL went up 55.10% from 2023 to 2024. 33843, FL home resale inventories is 166, which increased 30.71% since 2023. The average list price per square foot in 33843, FL is $213. 2023 it was $177.