In June 2024, 33853, FL homes were selling for an average price of $245,122, 33853, FL homes on average sell after 63 days on the market compared to 39 days last year. There were 249 homes sold in 33853, FL for June 2024, compared to 253 last year.
The average list price of 33853, FL, was $391,014 in June 2024, compared to $300,468 in June 2023.
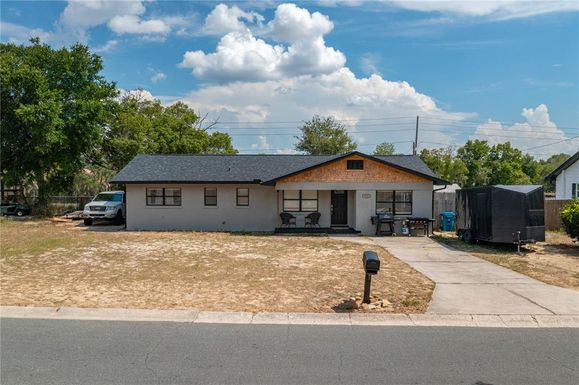
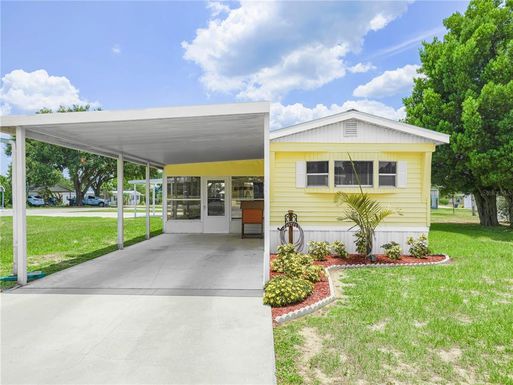
33853, FL Market Trend for Houses
Average List Price
The average list price of houses in 33853, FL, was $279,833 in June 2024, compared to $260,008 in June 2023.
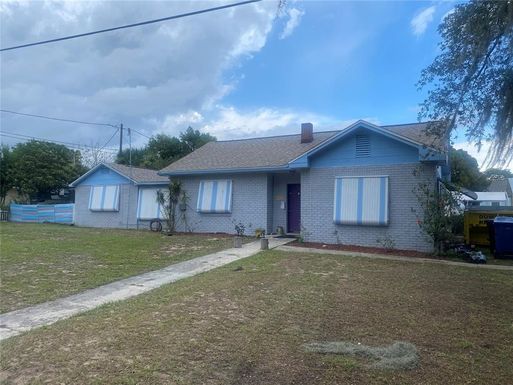
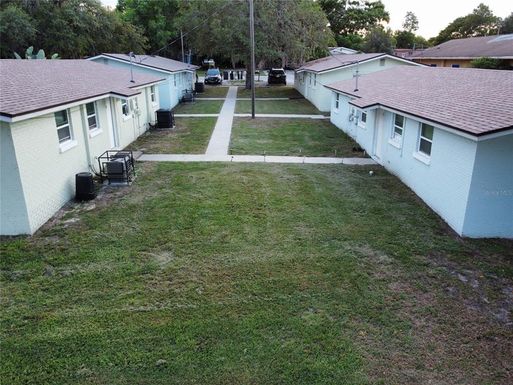
33853, FL Market Trend for Condos / Townhouses / Penthouses
Average List Price
The average list price of condos/co-ops in 33853, FL, was $111,495 in June 2024, compared to $128,000 in June 2023.
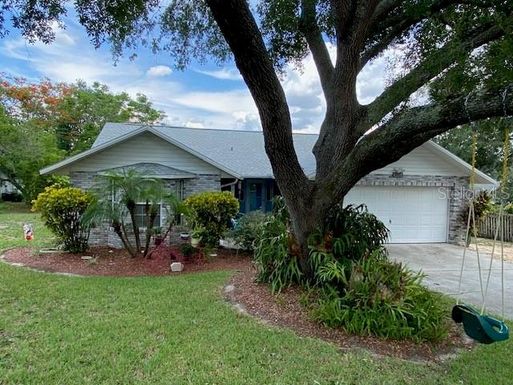
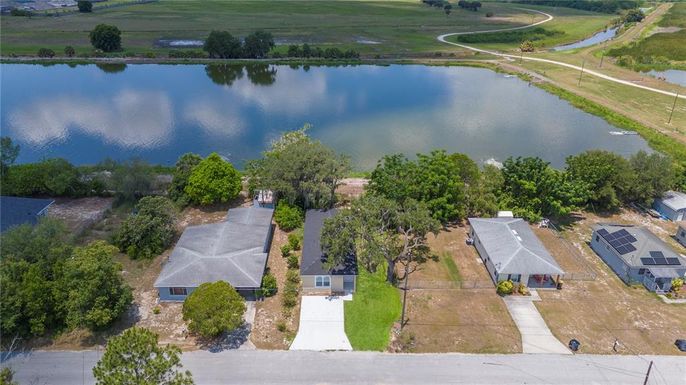
33853, FL Market Trend for Lots/Land
Average List Price
The average list price of lots/land in 33853, FL, was $514,587 in June 2024, compared to $455,825 in June 2023.
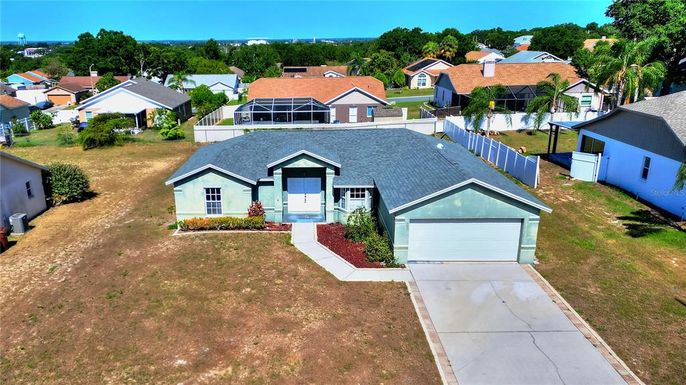
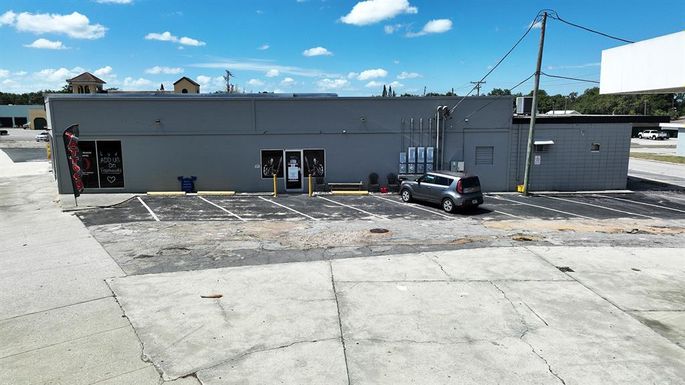
33853, FL Market Trend for Commercial
Average List Price
The average list price of commercial in 33853, FL, was $1,282,056 in June 2024, compared to $307,812 in June 2023.
33853, FL Housing Market Analysis
The average list price in 33853, FL is $391,014. The average list price in 33853, FL went up 23.52% from 2023 to 2024. 33853, FL home resale inventories is 115, which increased 43.75% since 2023. The average list price per square foot in 33853, FL is $181. 2023 it was $158.