In June 2024, 32169, FL homes were selling for an average price of $755,979, 32169, FL homes on average sell after 98 days on the market compared to 21 days last year. There were 42 homes sold in 32169, FL for June 2024, compared to 6 last year.
The average list price of 32169, FL, was $939,561 in June 2024, compared to $521,150 in June 2023.
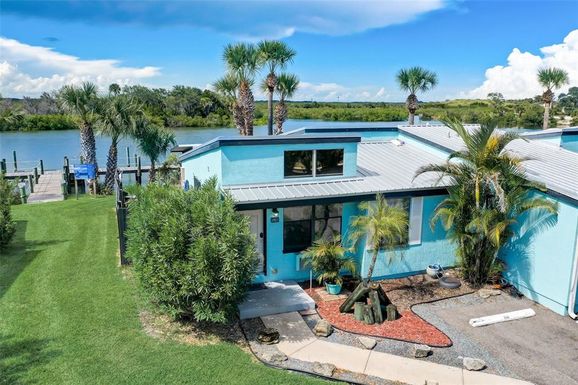
32169, FL Market Trend for Houses
Average List Price
The average list price of houses in 32169, FL, was $1,486,131 in June 2024, compared to $0 in June 2023.
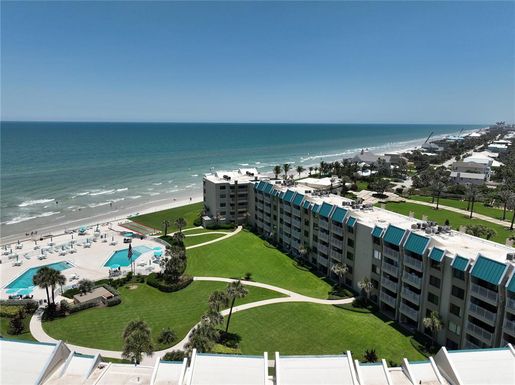
32169, FL Market Trend for Condos / Townhouses / Penthouses
Average List Price
The average list price of condos/co-ops in 32169, FL, was $591,679 in June 2024, compared to $501,580 in June 2023.
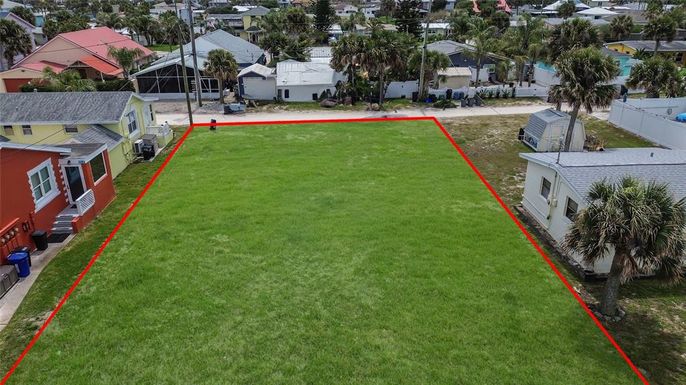
32169, FL Market Trend for Lots/Land
Average List Price
The average list price of lots/land in 32169, FL, was $820,322 in June 2024, compared to $619,000 in June 2023.
32169, FL Market Trend for Commercial
Average List Price
The average list price of commercial in 32169, FL, was $9,745,000 in June 2024, compared to $0 in June 2023.
32169, FL Housing Market Analysis
The average list price in 32169, FL is $939,561. The average list price in 32169, FL went up 74.56% from 2023 to 2024. 32169, FL home resale inventories is 233, which increased 2018.18% since 2023. The average list price per square foot in 32169, FL is $551. 2023 it was $391.