In June 2024, 33953, FL homes were selling for an average price of $171,943, 33953, FL homes on average sell after 174 days on the market compared to 97 days last year. There were 111 homes sold in 33953, FL for June 2024, compared to 45 last year.
The average list price of 33953, FL, was $256,610 in June 2024, compared to $155,581 in June 2023.
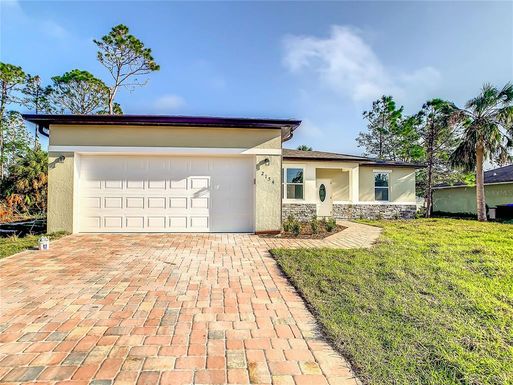
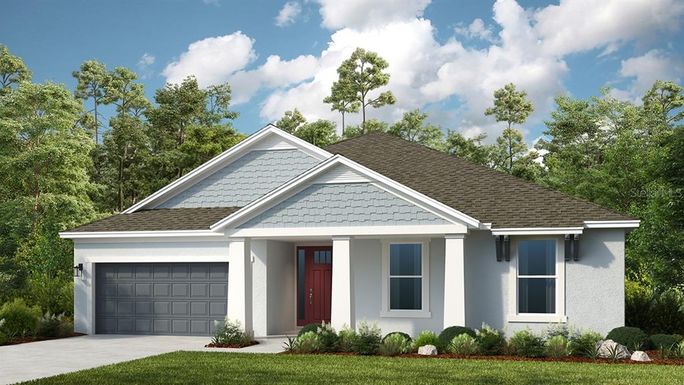
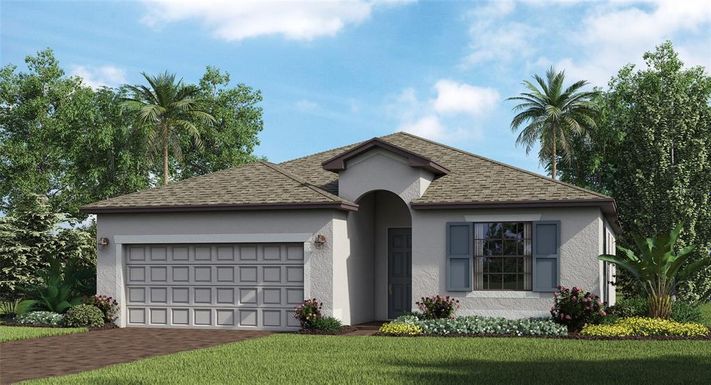
33953, FL Market Trend for Houses
Average List Price
The average list price of houses in 33953, FL, was $463,091 in June 2024, compared to $528,527 in June 2023.
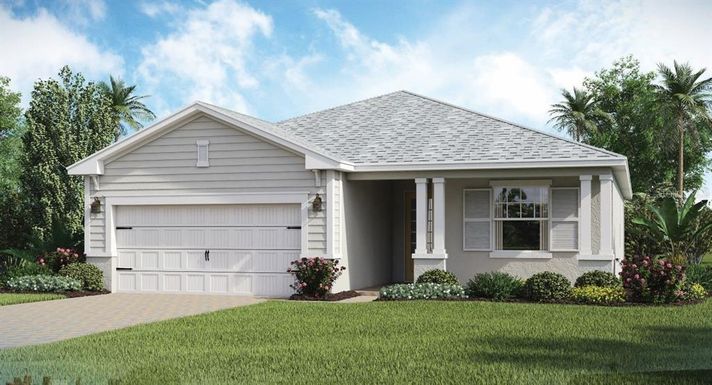
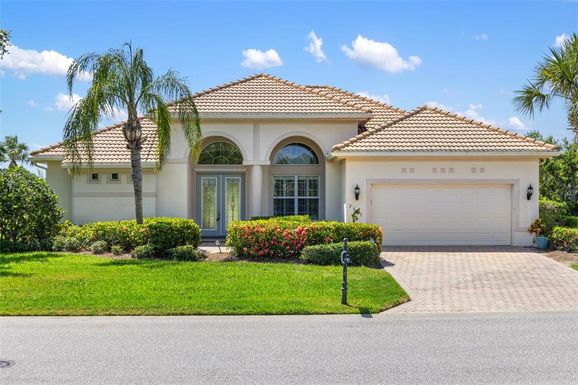
33953, FL Market Trend for Condos / Townhouses / Penthouses
Average List Price
The average list price of condos/co-ops in 33953, FL, was $314,261 in June 2024, compared to $0 in June 2023.
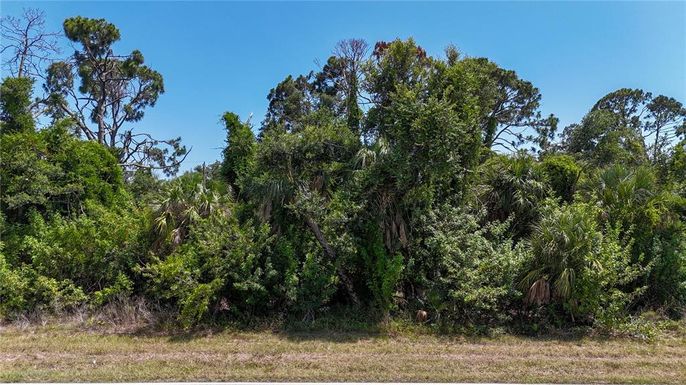
33953, FL Market Trend for Lots/Land
Average List Price
The average list price of lots/land in 33953, FL, was $43,331 in June 2024, compared to $61,428 in June 2023.
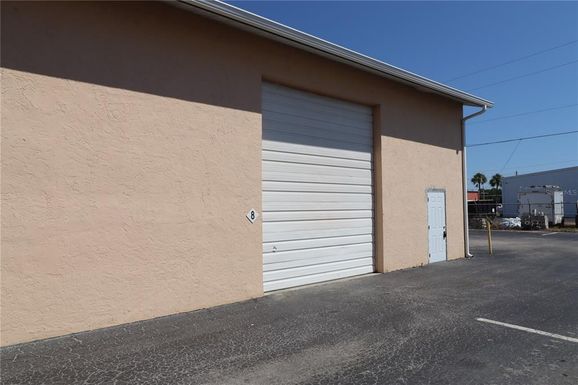
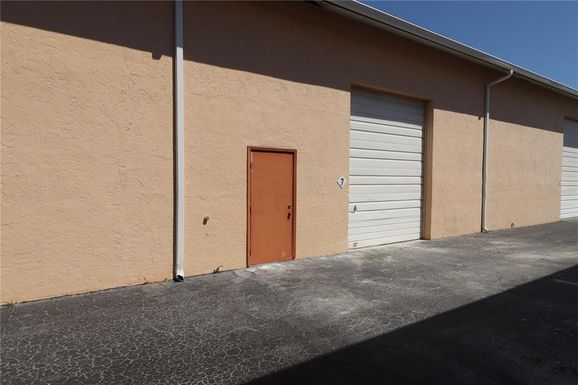
33953, FL Market Trend for Commercial
Average List Price
The average list price of commercial in 33953, FL, was $452,305 in June 2024, compared to $818,328 in June 2023.
33953, FL Housing Market Analysis
The average list price in 33953, FL is $256,610. The average list price in 33953, FL went up 69.15% from 2023 to 2024. 33953, FL home resale inventories is 421, which increased 338.54% since 2023. The average list price per square foot in 33953, FL is $254. 2023 it was $491.