In June 2024, 34293, FL homes were selling for an average price of $507,672, 34293, FL homes on average sell after 62 days on the market compared to 36 days last year. There were 1687 homes sold in 34293, FL for June 2024, compared to 1494 last year.
The average list price of 34293, FL, was $488,881 in June 2024, compared to $510,411 in June 2023.
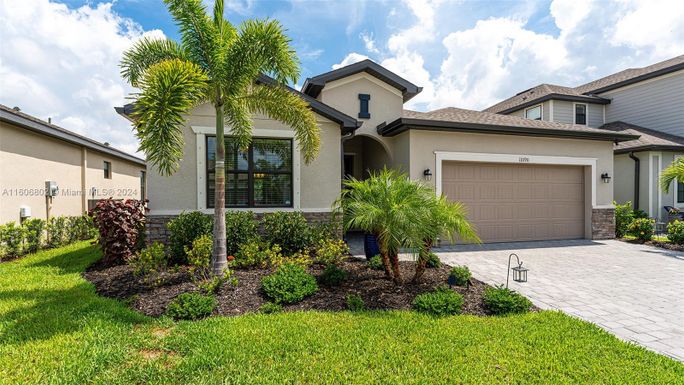
34293, FL Market Trend for Houses
Average List Price
The average list price of houses in 34293, FL, was $540,953 in June 2024, compared to $560,886 in June 2023.
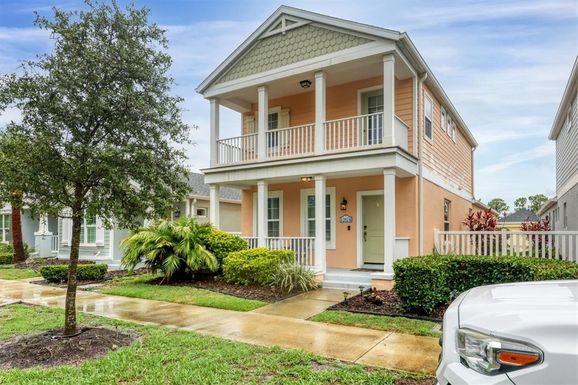
34293, FL Market Trend for Condos / Townhouses / Penthouses
Average List Price
The average list price of condos/co-ops in 34293, FL, was $350,353 in June 2024, compared to $371,157 in June 2023.
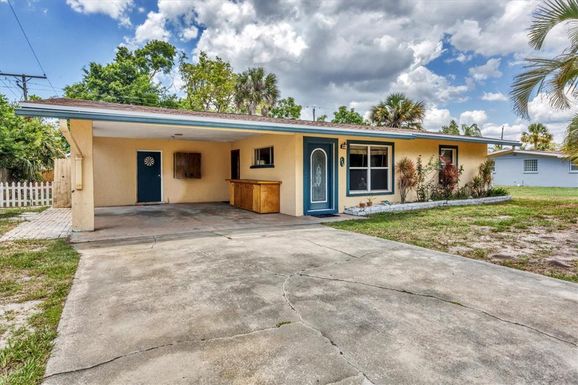
34293, FL Market Trend for Lots/Land
Average List Price
The average list price of lots/land in 34293, FL, was $212,486 in June 2024, compared to $176,410 in June 2023.
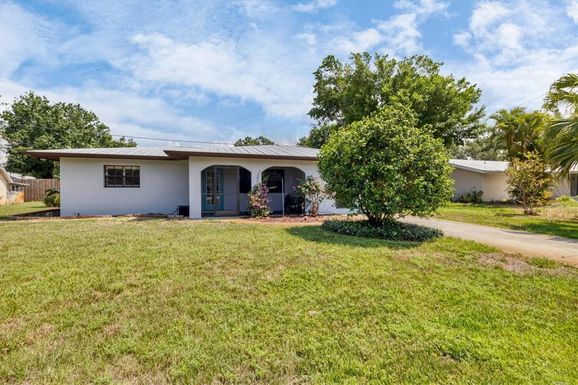
34293, FL Market Trend for Commercial
Average List Price
The average list price of commercial in 34293, FL, was $519,165 in June 2024, compared to $700,000 in June 2023.
34293, FL Housing Market Analysis
The average list price in 34293, FL is $488,881. The average list price in 34293, FL went down 5.52% from 2023 to 2024. 34293, FL home resale inventories is 786, which increased 83.22% since 2023. The average list price per square foot in 34293, FL is $281. 2023 it was $287.