In June 2024, 34286, FL homes were selling for an average price of $249,642, 34286, FL homes on average sell after 83 days on the market compared to 81 days last year. There were 70 homes sold in 34286, FL for June 2024, compared to 45 last year.
The average list price of 34286, FL, was $295,091 in June 2024, compared to $248,109 in June 2023.
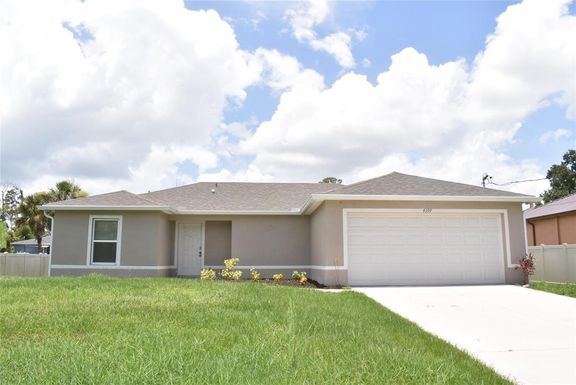
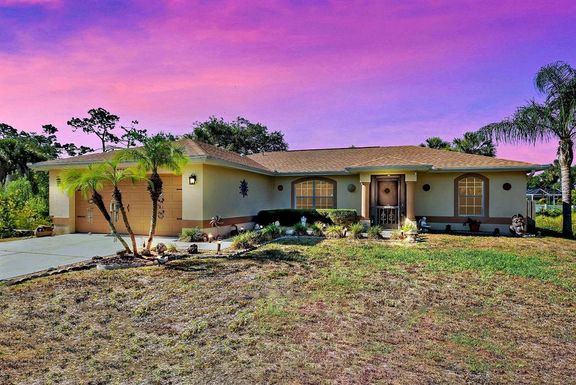
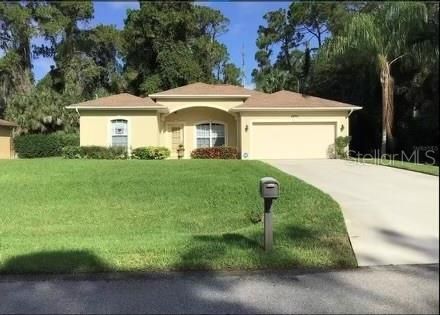
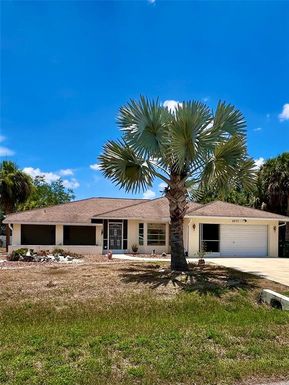
34286, FL Market Trend for Houses
Average List Price
The average list price of houses in 34286, FL, was $417,842 in June 2024, compared to $463,007 in June 2023.
34286, FL Market Trend for Condos / Townhouses / Penthouses
Average List Price
The average list price of condos/co-ops in 34286, FL, was $0 in June 2024, compared to $0 in June 2023.
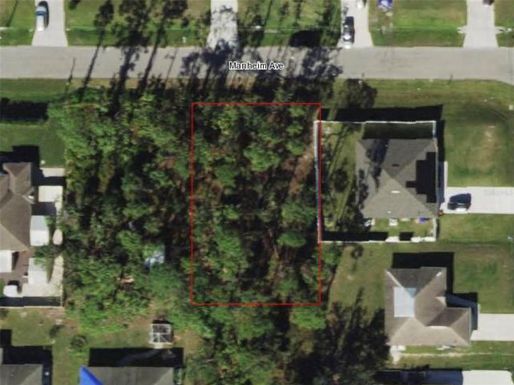
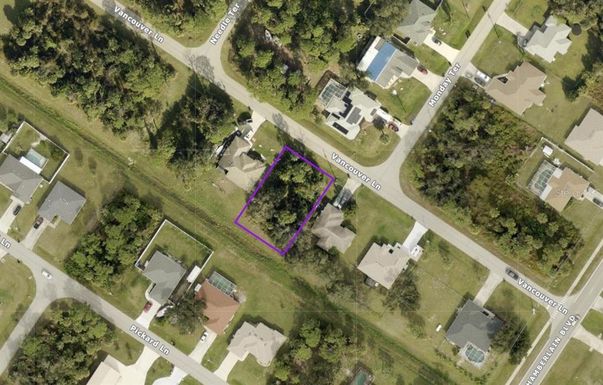
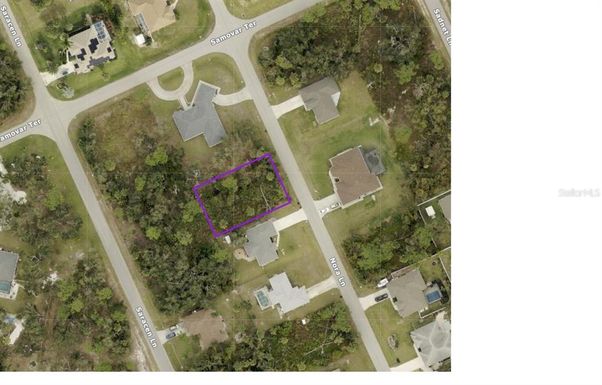
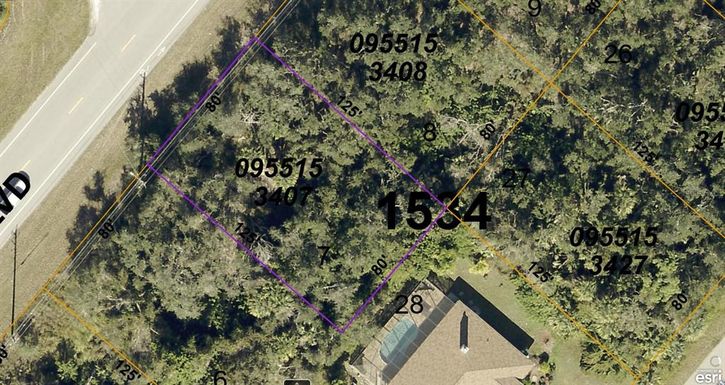
34286, FL Market Trend for Lots/Land
Average List Price
The average list price of lots/land in 34286, FL, was $82,227 in June 2024, compared to $113,488 in June 2023.
34286, FL Market Trend for Commercial
Average List Price
The average list price of commercial in 34286, FL, was $39,700 in June 2024, compared to $49,900 in June 2023.
34286, FL Housing Market Analysis
The average list price in 34286, FL is $295,091. The average list price in 34286, FL went up 9.91% from 2023 to 2024. 34286, FL home resale inventories is 283, which increased 543.18% since 2023. The average list price per square foot in 34286, FL is $238. 2023 it was $235.