In June 2024, 34269, FL homes were selling for an average price of $418,257, 34269, FL homes on average sell after 119 days on the market compared to 123 days last year. There were 7 homes sold in 34269, FL for June 2024, compared to 1 last year.
The average list price of 34269, FL, was $414,500 in June 2024, compared to $414,725 in June 2023.
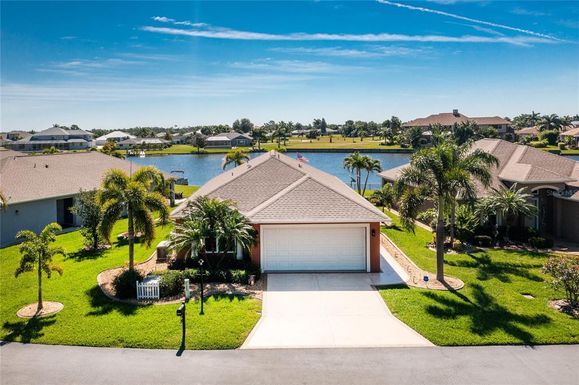
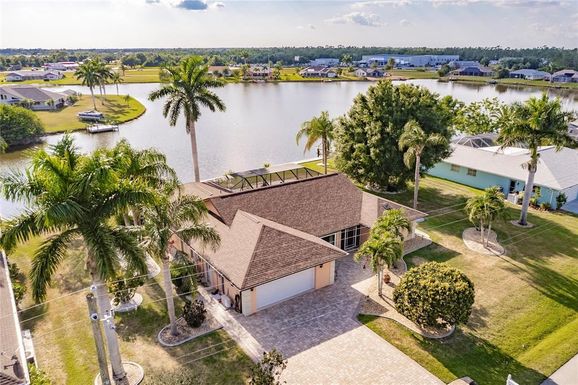
34269, FL Market Trend for Houses
Average List Price
The average list price of houses in 34269, FL, was $540,540 in June 2024, compared to $541,300 in June 2023.
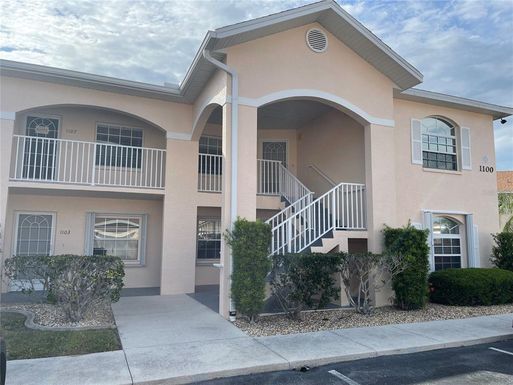
34269, FL Market Trend for Condos / Townhouses / Penthouses
Average List Price
The average list price of condos/co-ops in 34269, FL, was $264,967 in June 2024, compared to $0 in June 2023.
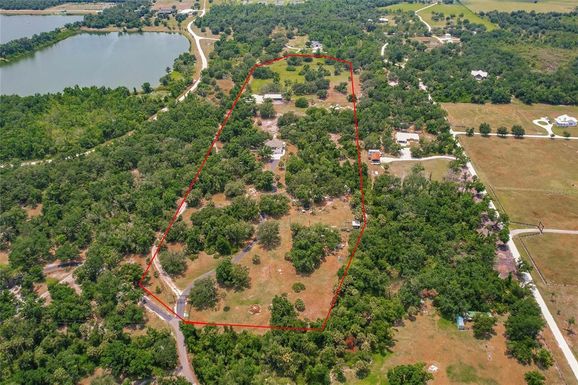
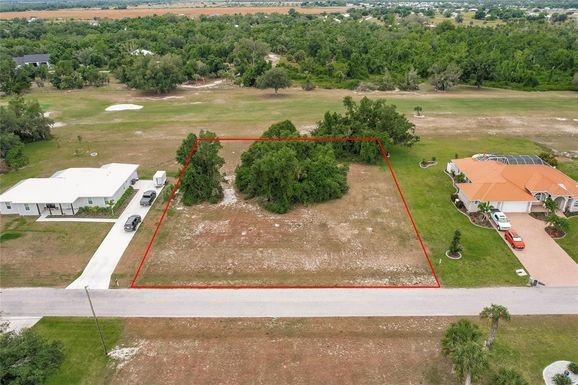
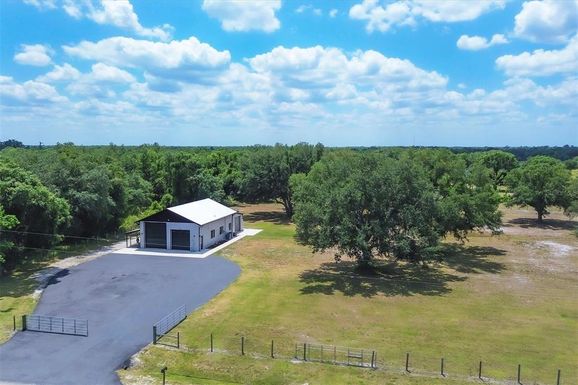
34269, FL Market Trend for Lots/Land
Average List Price
The average list price of lots/land in 34269, FL, was $57,967 in June 2024, compared to $35,000 in June 2023.
34269, FL Market Trend for Commercial
Average List Price
The average list price of commercial in 34269, FL, was $0 in June 2024, compared to $0 in June 2023.
34269, FL Housing Market Analysis
The average list price in 34269, FL is $414,500. The average list price in 34269, FL went down 0.05% from 2023 to 2024. 34269, FL home resale inventories is 44, which increased 1000.00% since 2023. The average list price per square foot in 34269, FL is $242. 2023 it was $299.