In June 2024, 33983, FL homes were selling for an average price of $284,423, 33983, FL homes on average sell after 92 days on the market compared to 59 days last year. There were 762 homes sold in 33983, FL for June 2024, compared to 677 last year.
The average list price of 33983, FL, was $287,999 in June 2024, compared to $234,376 in June 2023.
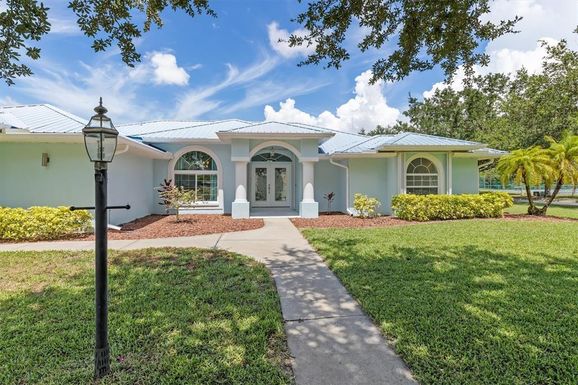
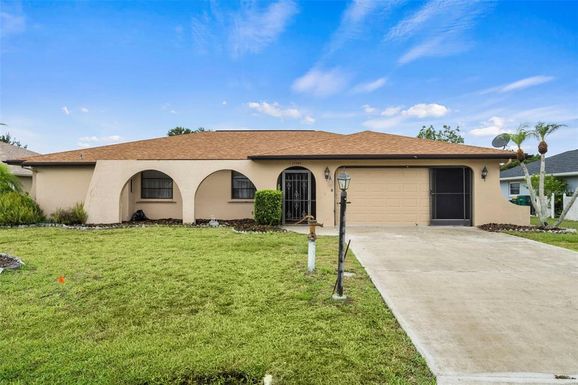
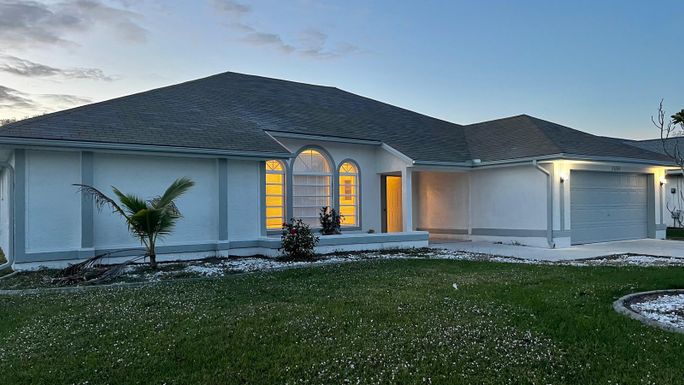
33983, FL Market Trend for Houses
Average List Price
The average list price of houses in 33983, FL, was $433,418 in June 2024, compared to $403,010 in June 2023.
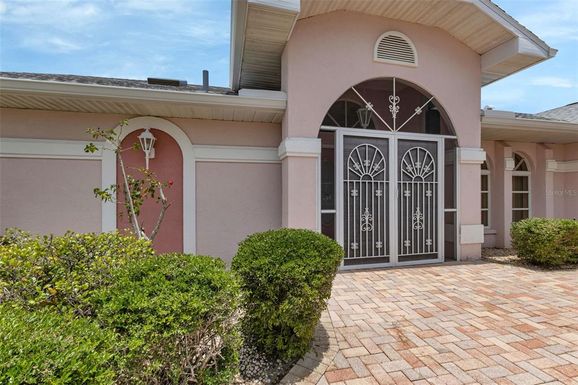
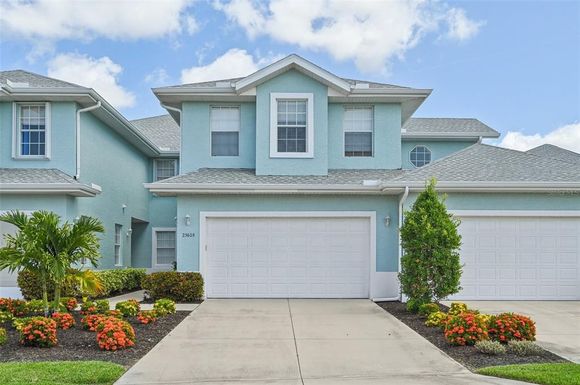
33983, FL Market Trend for Condos / Townhouses / Penthouses
Average List Price
The average list price of condos/co-ops in 33983, FL, was $221,223 in June 2024, compared to $212,276 in June 2023.
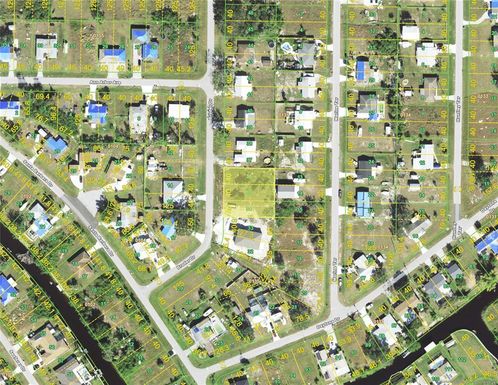
33983, FL Market Trend for Lots/Land
Average List Price
The average list price of lots/land in 33983, FL, was $71,734 in June 2024, compared to $60,174 in June 2023.
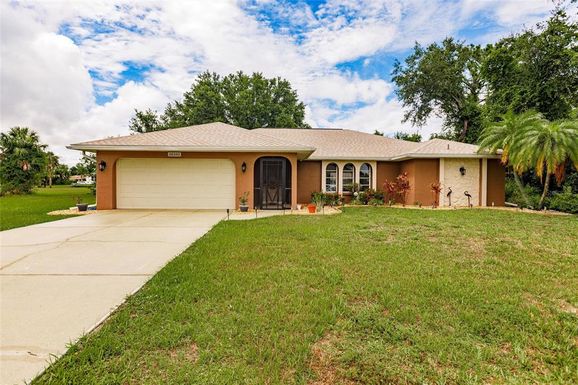
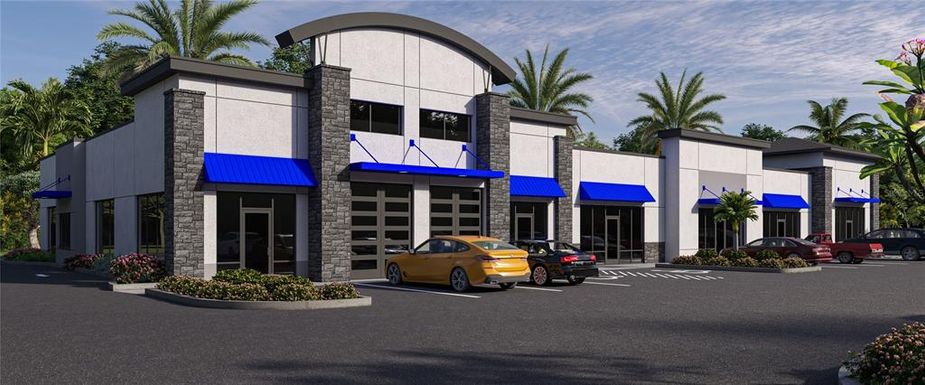
33983, FL Market Trend for Commercial
Average List Price
The average list price of commercial in 33983, FL, was $18,425 in June 2024, compared to $229,650 in June 2023.
33983, FL Housing Market Analysis
The average list price in 33983, FL is $287,999. The average list price in 33983, FL went up 23.14% from 2023 to 2024. 33983, FL home resale inventories is 403, which increased 14.81% since 2023. The average list price per square foot in 33983, FL is $209. 2023 it was $207.