In June 2024, 34758, FL homes were selling for an average price of $333,661, 34758, FL homes on average sell after 59 days on the market compared to 43 days last year. There were 757 homes sold in 34758, FL for June 2024, compared to 745 last year.
The average list price of 34758, FL, was $338,587 in June 2024, compared to $343,377 in June 2023.
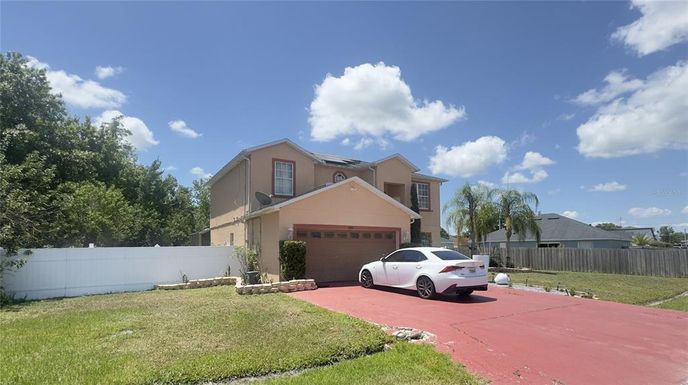
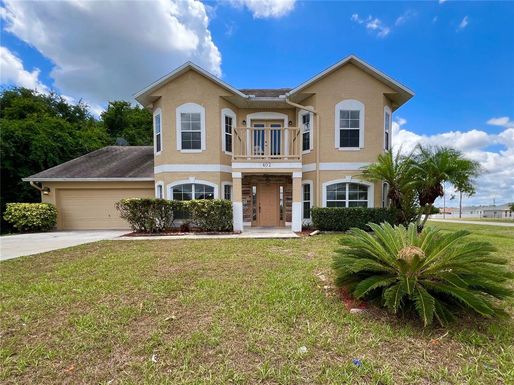
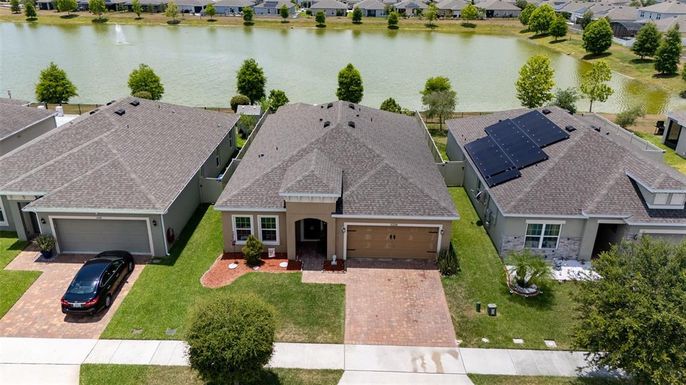
34758, FL Market Trend for Houses
Average List Price
The average list price of houses in 34758, FL, was $368,064 in June 2024, compared to $360,137 in June 2023.
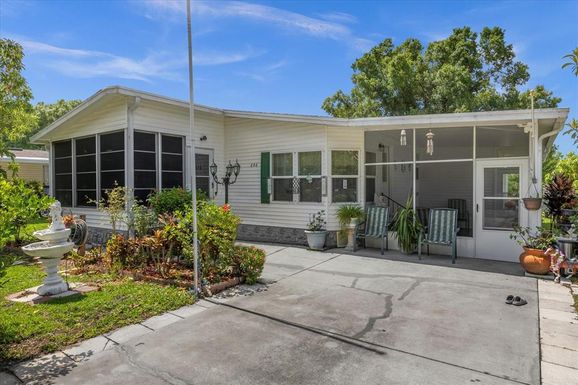
34758, FL Market Trend for Condos / Townhouses / Penthouses
Average List Price
The average list price of condos/co-ops in 34758, FL, was $270,659 in June 2024, compared to $276,791 in June 2023.
34758, FL Market Trend for Lots/Land
Average List Price
The average list price of lots/land in 34758, FL, was $92,372 in June 2024, compared to $127,599 in June 2023.
34758, FL Market Trend for Commercial
Average List Price
The average list price of commercial in 34758, FL, was $79,999 in June 2024, compared to $1,609,250 in June 2023.
34758, FL Housing Market Analysis
The average list price in 34758, FL is $338,587. The average list price in 34758, FL went up 0.70% from 2023 to 2024. 34758, FL home resale inventories is 243, which increased 3.85% since 2023. The average list price per square foot in 34758, FL is $192. 2023 it was $187.