South Florida commercial real estate is having a moment. Across Miami-Dade, Broward, and Palm Beach counties, 2025 closed with roughly $16 billion in commercial transactions — a double-digit increase over the prior year. CBRE projects U.S. commercial investment activity will grow 16% in 2026, and South Florida sits at the front of that wave.
But aggregate numbers hide the real story. Different sectors, different submarkets, and different buyer profiles are moving in opposite directions. Here's what's actually happening and where capital is going.
Our Data: LLC Ownership & Active Construction
Two signals we track on brokerone.io tell the story before the transaction data does:
Corporate Ownership Concentration
| County | Total Parcels | LLC/Corp Owned | Corporate Share |
|---|
| Miami-Dade | 799,138 | 182,190 | 22.8% |
| Palm Beach | 664,384 | 121,118 | 18.2% |
| Broward | 524,228 | 71,926 | 13.7% |
Miami-Dade's 22.8% corporate ownership share is among the highest in the country. This matters because LLC-owned property behaves differently from individual-owned: it tends to hold longer, is more likely to be refinanced than sold, and responds to institutional capital cycles rather than local wage growth. The elevated corporate share across all three counties is what's kept transaction volume high even as residential buyer sentiment cooled in 2024.
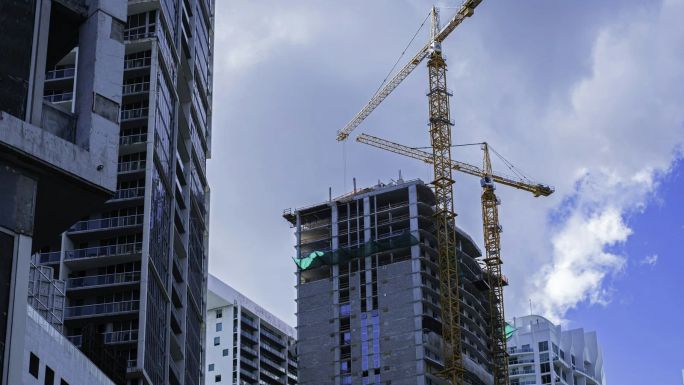
Construction Activity
Our permits database shows $736 million in large building permits ($100K+) issued across South Florida in the 14 months starting January 2025. Over $1M permits alone number more than 110. This is the pipeline of coming supply — and the fact that commercial permit volume has outpaced residential for the first time in over a decade tells you where developers think the capital is going.
You can explore live construction data at brokerone.io/construction or look up specific LLC ownership in our owner lookup tool.
The Macro Picture
Sales Volume by County (2025)
| County | Total Volume | YoY Change | Signal |
|---|
| Miami-Dade | ~$7.7B | +5% | Steady, institutional-heavy |
| Broward | $5.5B | +27% | Breakout year, industrial-driven |
| Palm Beach | $2.8B | +12% | Wealth migration continues |
Broward's 27% jump is the standout. Logistics and industrial activity near the ports and airport drove the surge, with private equity and family offices writing the biggest checks. Palm Beach's 12% gain reflects the continued wealth migration from the Northeast — demand for office, medical, and net-lease retail has outpaced supply.
The Vacancy Picture
South Florida remains one of the tightest major office markets in the country:
- West Palm Beach — 14.0% vacancy, the tightest market in Florida
- Miami — 14.3% vacancy, Class A trophy space is especially scarce
- Broward — 15.9% vacancy, softer but improving in Fort Lauderdale's core
Compare these numbers to national Class A office vacancy of roughly 19%, and the picture sharpens: South Florida's office market never cratered the way New York and San Francisco did. That's why rents held firm and cap rates stayed compressed.
Sector Breakdown: Where to Look
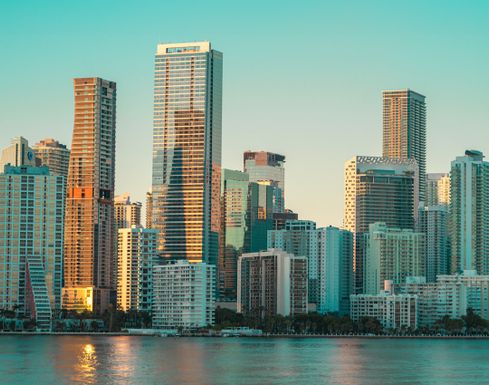
Office
Class A office is still the crown jewel. Brickell and Downtown Miami trade at cap rates around 4.5–5.5% for stabilized product. West Palm Beach's Rosemary Square and Flagler corridor trade similarly — these are institutional holdings where rent growth has compounded for five straight years.
The value play is Class B office with value-add potential. These trade at 8%+ cap rates in suburban Broward and peripheral Miami-Dade. The bet: office demand isn't dying, it's relocating. Tenants are leaving glass towers for renovated warehouse conversions with better parking and lower rents per square foot.
Browse active office listings:
Industrial & Logistics
Industrial is the asset class everyone wants and nobody can build fast enough. Port Everglades, PortMiami, and Miami International Airport together move more cargo than any other U.S. metro east of the Mississippi. That creates insatiable demand for last-mile distribution, flex space, and cold storage.
- Doral / Medley — the airport-adjacent industrial heart of Miami-Dade. Cap rates in the 5.0–5.5% range for stabilized warehouses.
- Hialeah Gardens, Miami Gardens, Opa-Locka — value plays at 6–7% caps with upside if you can re-tenant.
- Pompano Beach, Deerfield Beach — Broward's industrial corridor, benefiting from both Fort Lauderdale-Hollywood logistics and Palm Beach County overflow.
Recent deals in Doral have closed north of $19M for sub-60,000 sq ft facilities — an indicator of how compressed pricing has become.
Browse active industrial listings:
Retail
Retail is bifurcating. Street retail on Lincoln Road, Worth Avenue, and the Design District trades at aggressive cap rates (3.5–4.5%) and behaves more like a trophy asset than a yield play. Meanwhile, grocery-anchored and net-lease retail across the suburban Tri-County corridor offers 5.5–7% caps with long-term credit tenants.
The action is in redevelopment plays. Older strip centers in transitioning neighborhoods — Wynwood five years ago, Little River now, Edgewater before that — have delivered outsized returns for investors willing to hold through entitlements and wait out the rezoning timeline.
Submarkets worth a close look:
Multifamily
Multifamily is the sector where institutional capital meets every kind of private buyer. Class A Brickell and Edgewater towers trade around 4.0% cap rates — compressed, but backed by some of the strongest rent growth in the country. Workforce housing in Hialeah, Hollywood, and Pompano offers 5.5–6.5% caps with political tailwinds (Live Local Act, various county incentives).
The opportunity that's being overlooked: small multifamily (4–20 units) in gentrifying Miami neighborhoods. These trade at 5.5–7% caps, can often be financed with residential loans, and benefit from the same neighborhood-level appreciation as single-family product.
Hospitality
South Florida hospitality is its own universe. Boutique hotels in South Beach, ocean-side resorts in Fort Lauderdale and Hollywood, and high-end resort-branded residences in Aventura and Sunny Isles have outperformed national hospitality REITs by wide margins. Cap rates range 5.5–7%, but underwriting requires deep operational expertise — this isn't a mailbox-money asset class.
Who's Buying
The buyer pool has shifted meaningfully in the past three years:
- Institutional capital — REITs, pension funds, and sovereign wealth are concentrated in Class A office, industrial portfolios, and large multifamily. Deal size generally $50M+.
- Family offices — the fastest-growing buyer class. Writing checks from $5M to $50M, often for generational holds. Particularly active in industrial, net-lease retail, and small-bay commercial condos.
- Foreign investors — still present but more selective than 2021–2022. Latin American capital remains dominant in Brickell condos and retail; European and Middle Eastern money favors hotels and trophy office.
- Private investors — entrepreneurs, 1031 exchange buyers from other states, and owner-operators are the largest group by count. They dominate the sub-$5M transaction space.
The Suburban Arbitrage
One structural opportunity keeps showing up in the data: suburban submarkets trade at roughly 60 basis points higher cap rates than core Miami-Dade, despite comparable fundamentals. Family offices are increasingly exploiting this spread, buying in Sunrise, Coral Springs, Delray Beach, and Boca Raton at 5.3% caps instead of chasing 4.0% deals downtown.
Financing & Cost of Capital
Commercial mortgage rates sit meaningfully above the residential market. Agency multifamily financing is available in the 6–6.5% range. Non-recourse commercial loans on stabilized office and retail run 6.5–7.5%. Bridge and construction financing start above 8% for most borrowers.
The refinancing wave coming in 2026–2027 is the biggest wildcard. Many 5-year deals originated in 2020–2021 are maturing into a higher-rate environment. Expect more distressed sales, more recapitalizations, and more opportunities for well-capitalized buyers over the next 18 months.
Our Take
South Florida commercial is not a monolith. There are five distinct markets under one headline, and each has its own entry point:
- For institutional capital — Class A office in Brickell and Rosemary Square remain the cleanest plays.
- For family offices — the suburban industrial and net-lease retail arbitrage is still live. Act before it closes.
- For private investors — look at small multifamily in gentrifying Miami neighborhoods and value-add Class B office in inner-ring Broward.
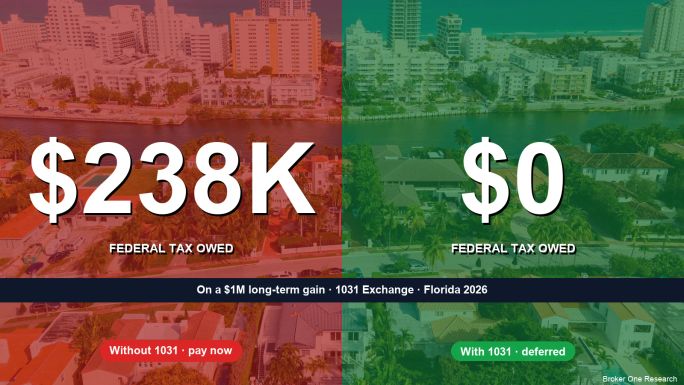
- For 1031 exchange buyers — net-lease retail and medical office offer the cleanest swap from appreciated residential.
- For opportunistic buyers — wait for the refinancing wave. Deals will come.
The 16% growth projection for 2026 isn't a prediction about one asset class — it's the sum of multiple overlapping cycles. The investors who do best next year will be the ones who know which sector and which submarket matches their capital structure, and they'll move while others are still watching the interest-rate headlines.
Further Reading