Buying vs Renting in South Florida: The 2026 Zip-Code Map
Every buyer eventually asks the same question: am I better off renting or buying right now? Usually it's answered with a calculator, a 30-year mortgage schedule, and a lot of hand-waving. We prefer data.
We pulled every active rental listing and every closed sale across 147 South Florida zip codes (Miami-Dade, Broward, Palm Beach), calculated a price-to-rent (P/R) ratio for each, and mapped the results. The pattern is cleaner than we expected — and it inverts what most locals assume about their own neighborhoods.
The Rule of Thumb (and Why It Still Works)
The price-to-rent ratio is the median sale price of a home divided by 12 months of median rent for comparable properties in the same zip. A widely used interpretation:
P/R < 15 — buying is usually the smarter play. Mortgage + taxes + insurance typically run close to, or less than, what you'd pay a landlord.
P/R 15-20 — it's a toss-up. The math depends on your tax bracket, how long you'll stay, and how much HOA / insurance volatility you can absorb.
P/R > 20 — renting is usually financially better. Every dollar of "extra" cost you'd be paying as an owner could instead be invested.
This is not a law of physics. Rent controls, HOA dues, insurance shocks, and tax differentials between primary-residence and non-homestead can shift the break-even by 20-30%. But as a first filter across 147 zip codes, it's a remarkably clean signal.
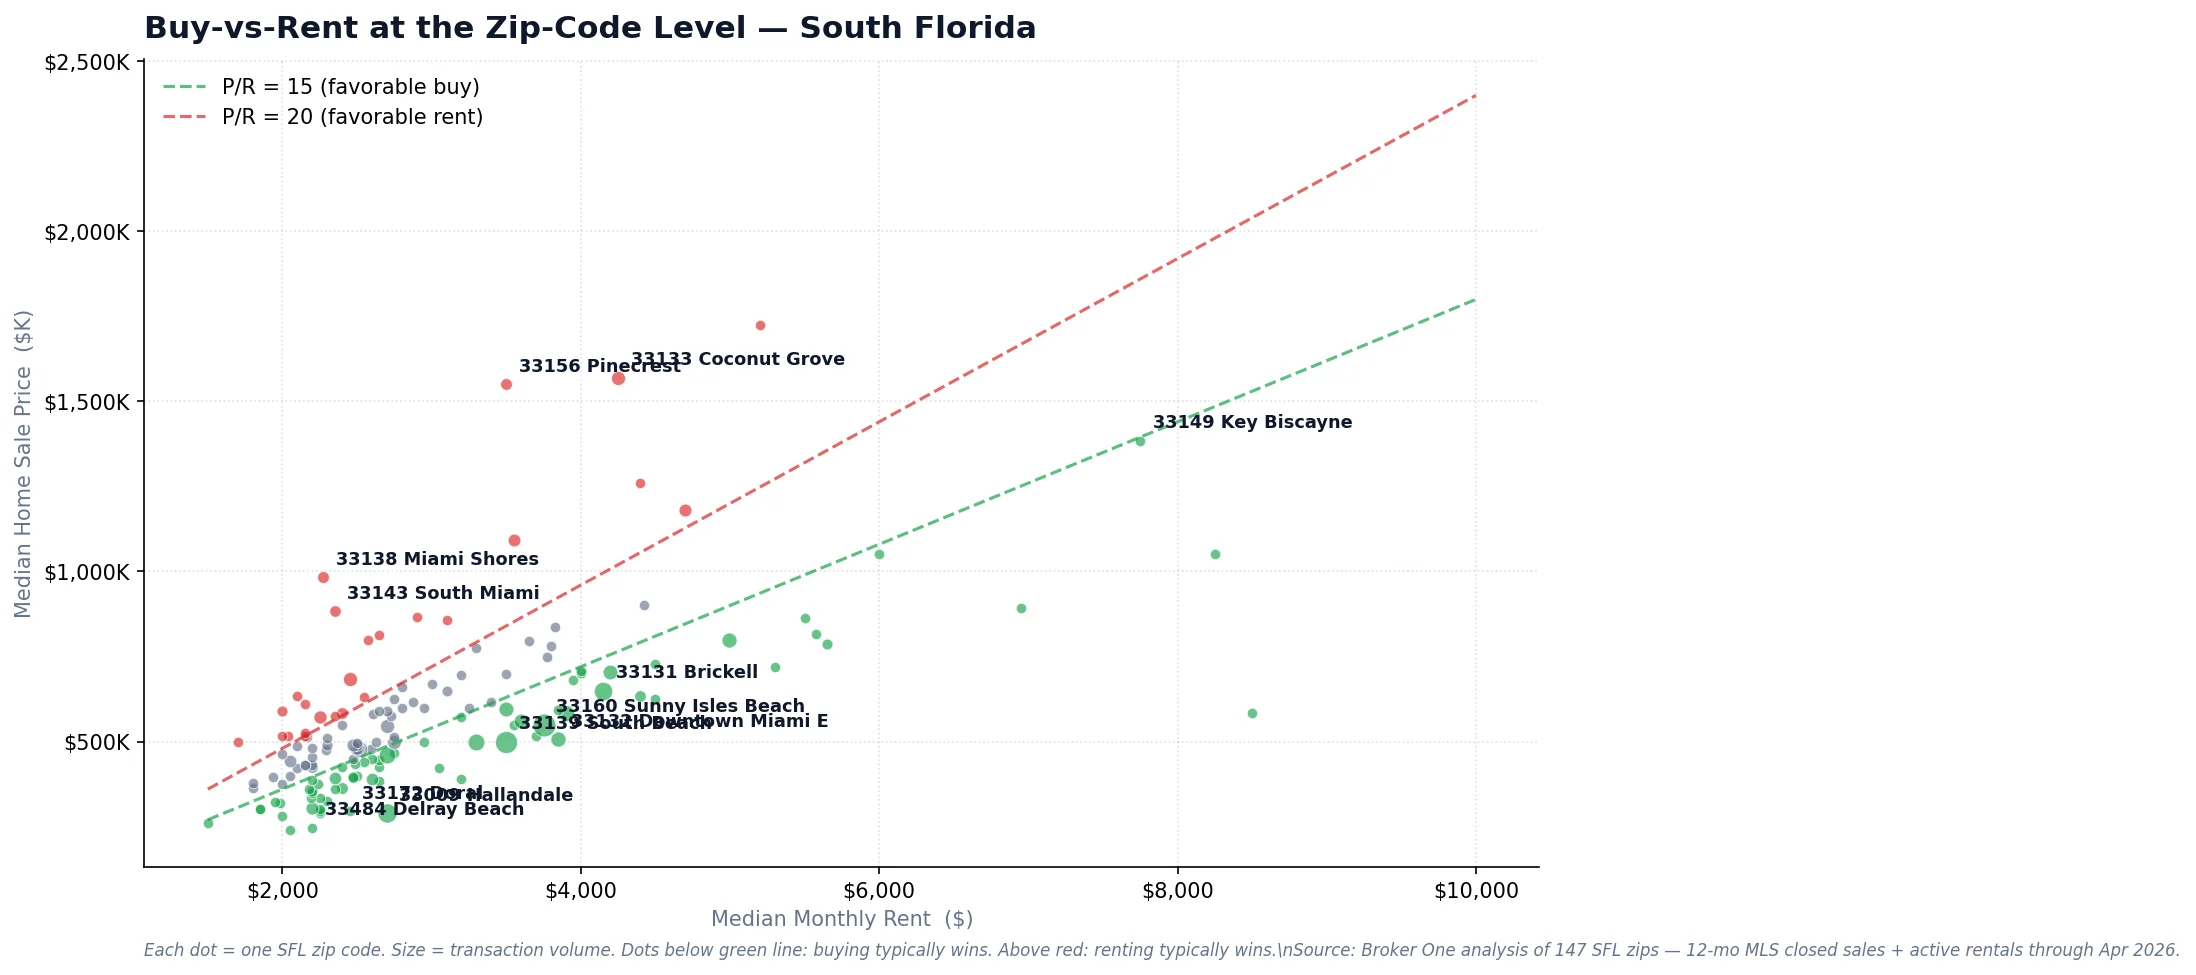
The South Florida Map
Each dot is a South Florida zip code. Zips below the green diagonal favor buying; zips above the red diagonal favor renting. The gap between dense lower-price zip clusters and luxury SFH outliers is the real story.
Two visual patterns jump out:
Condo-heavy zips cluster below the green line. Hallandale Beach, Doral, Downtown Miami, South Beach, Sunny Isles, Aventura — the whole coastal condo corridor — price in the "buying is cheaper than renting" zone right now. That's a direct consequence of the 2024-2026 condo correction we covered in our Miami condo crash analysis: when sale prices fall faster than rents, P/R ratios compress into buy-favored territory.
Established luxury-SFH zips sit high above the red line. Pinecrest, Coconut Grove, South Miami, Coral Gables, Miami Shores — these markets carry P/R ratios of 26-37. Rents have lagged far behind sale-price growth, because the renter pool for a $1.5M house is much thinner than the buyer pool.
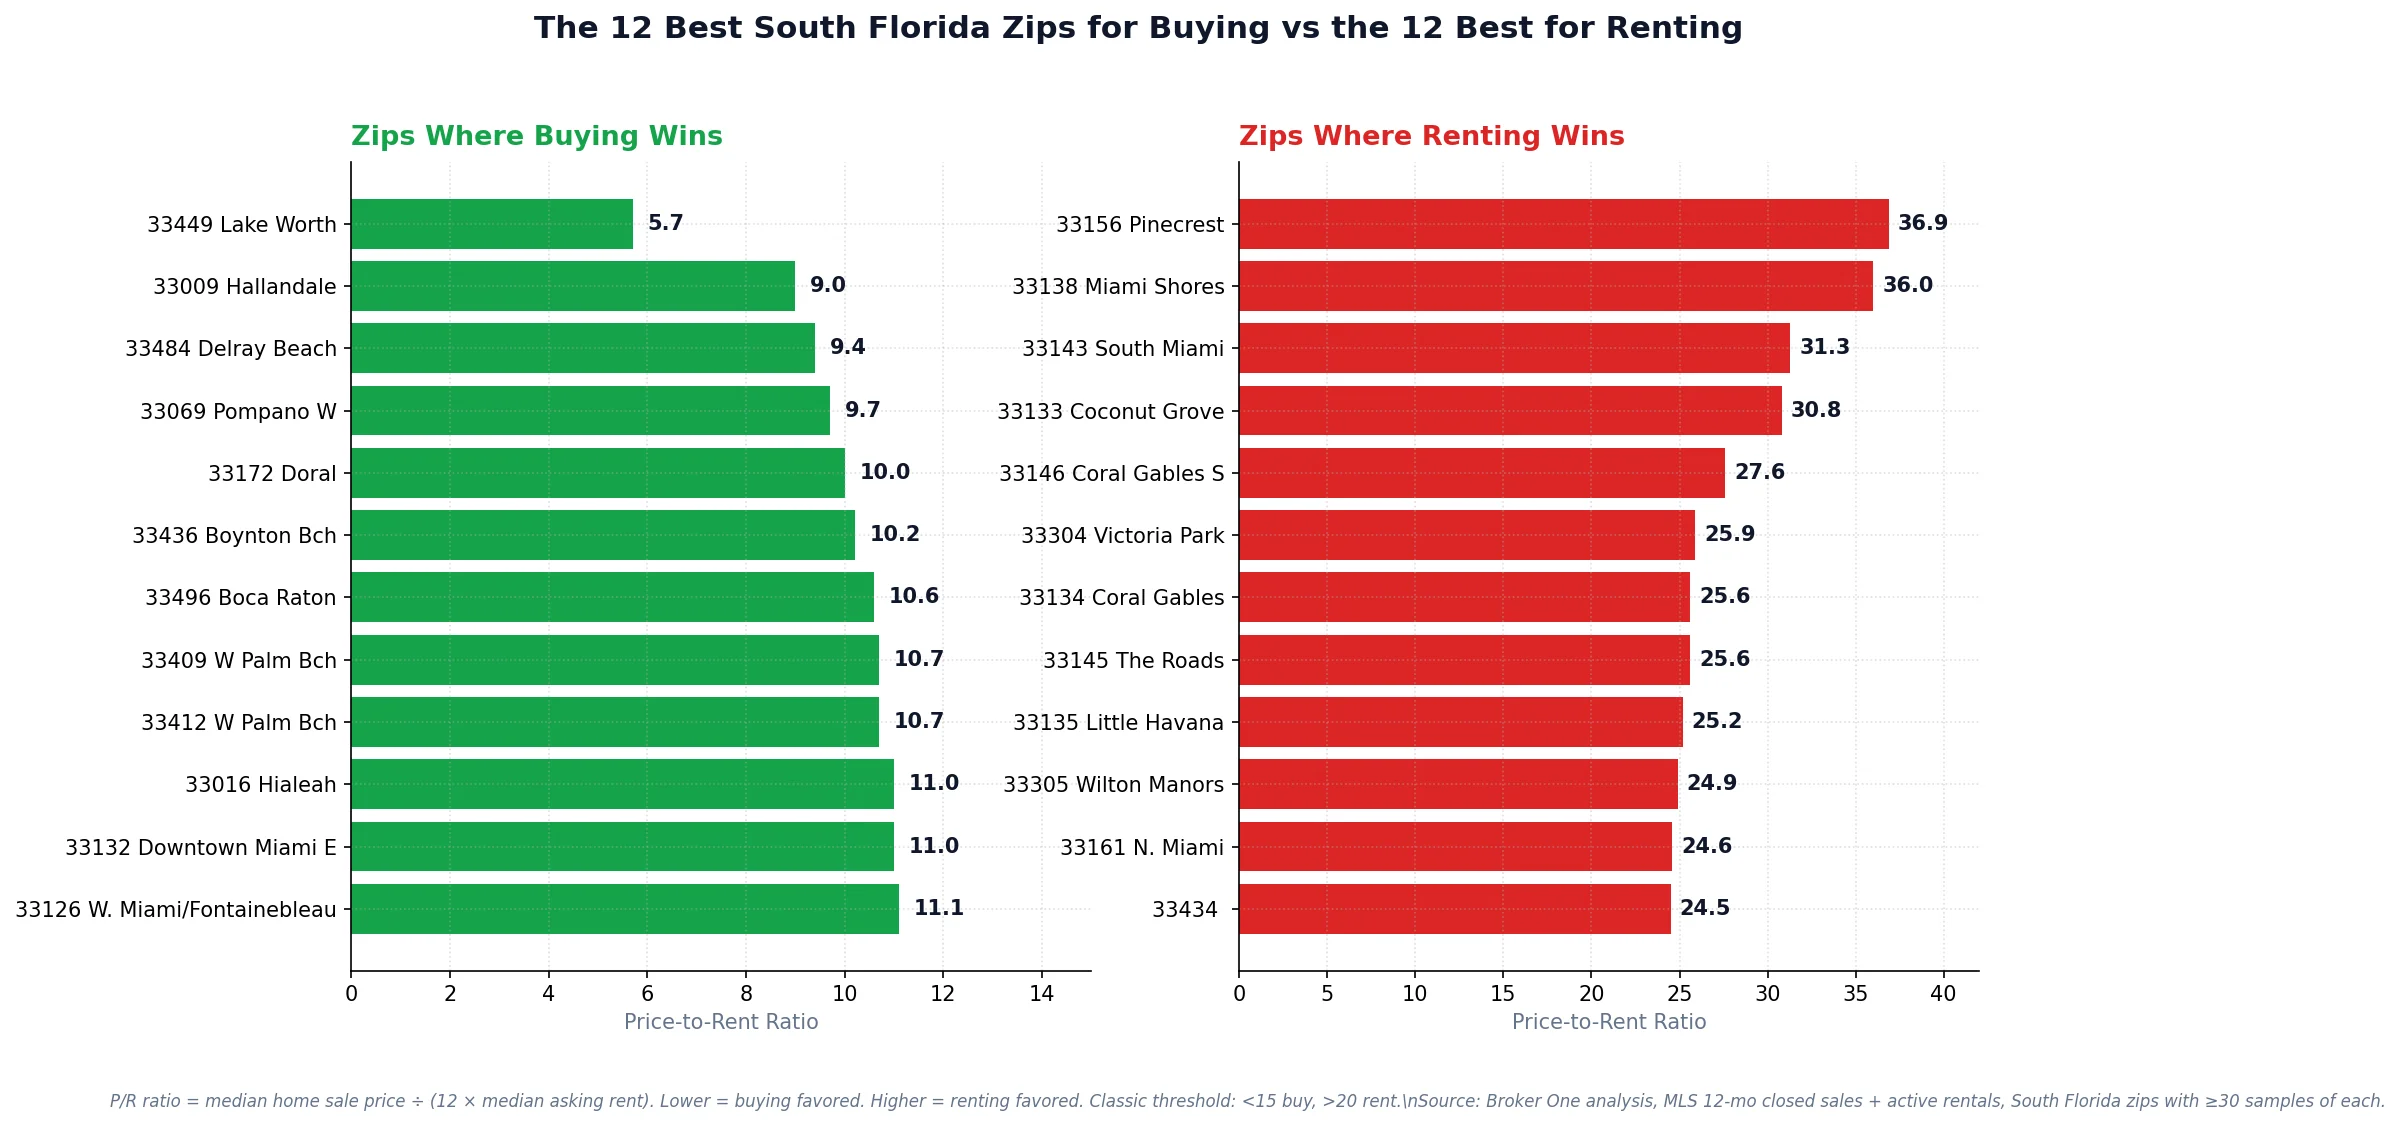
The 12 Best Zips to Buy Instead of Rent
These zip codes have at least 30 closed sales and at least 30 rental listings in the past year — enough data for both sides of the ratio to be stable.
Left: where buying wins. Right: where renting wins. The split is almost perfectly correlated with housing mix — condos/townhomes on the left, detached single-family on the right.
$269K median condo against $2,450 rent. Strong rental demand from the business-district commute crowd while resale prices flattened.
Downtown Miami East 33132 — P/R 11.0
Interesting case — new-construction deliveries (Aston Martin, Waldorf, etc.) pushed the median sale price up, but rents also kept up. The P/R stays in buy territory because the numerator and denominator moved together.
This one surprises people. $500K median sale, $3,500 median rent. The SB 4-D correction pulled condo prices down while seasonal/peak-season rent demand held.
The poster child of the 2026 condo correction. Prices down 33% YoY in some buildings, but rents barely moved. Best-time-in-a-decade to buy if you can stomach the SB 4-D math.
Hollywood Beach 33019 — P/R 12.5
Waterfront condo-heavy zip. $470K median sale, $3,900 rent. Supply running ahead of demand pulls the ratio into buy-favored territory.
High HOA fees scare buyers; renters absorb that cost invisibly through rent. Same building, same unit: buy if you plan to hold, rent if you're transient.
Pattern: condo-heavy zip codes are buy-favored in 2026 because sale prices compressed faster than rents did. If you're a buyer with flexible credit, cash for reserves, and patience to absorb HOAs, these are the zips where mortgage + taxes + insurance is already cheaper than writing a rent check.
$1.55M median sale. $3,500 median rent. To buy instead of rent, you need to live here 20+ years to break even against disciplined investing of the difference.
Miami Shores 33138 — P/R 36.0
Historic SFH neighborhood; rental inventory heavily 2-bedroom mid-century homes at $2,275 while sale prices climbed past $980K.
South Miami 33143 — P/R 31.3
$883K median sale vs $2,350 rent. Same dynamic: thin rental pool for luxury SFH.
Villa prices up 7% this year while rents held at $4,250. Owner wealth growth doesn't move the rent market here.
Coral Gables South 33146 — P/R 27.6
$1.73M median sale, $5,200 rent. Classic "you rent here if you're a surgeon on a 4-year fellowship, buy if you're rooted."
Fort Lauderdale Victoria Park 33304 — P/R 25.9
$800K median sale, $2,575 rent. Relocation-heavy rental pool keeps rents soft while sale prices track broader Broward appreciation.
Silver Bluff / Roads 33145 — P/R 25.6
Urban-Miami SFH corridor. Prices following the city boom, rents lagging by the tenant-income ceiling.
Coral Gables 33134 — P/R 25.6
Same story as 33146 but with older housing stock. Buy only if you want to be there 10+ years.
Pattern: established luxury single-family zip codes are rent-favored because the rental market never kept up with 2021-2025 sale-price appreciation. Renters in these zips are genuinely getting a deal — they pay 3-4% of asset value per year instead of the 5-6% an owner would pay in carrying costs.
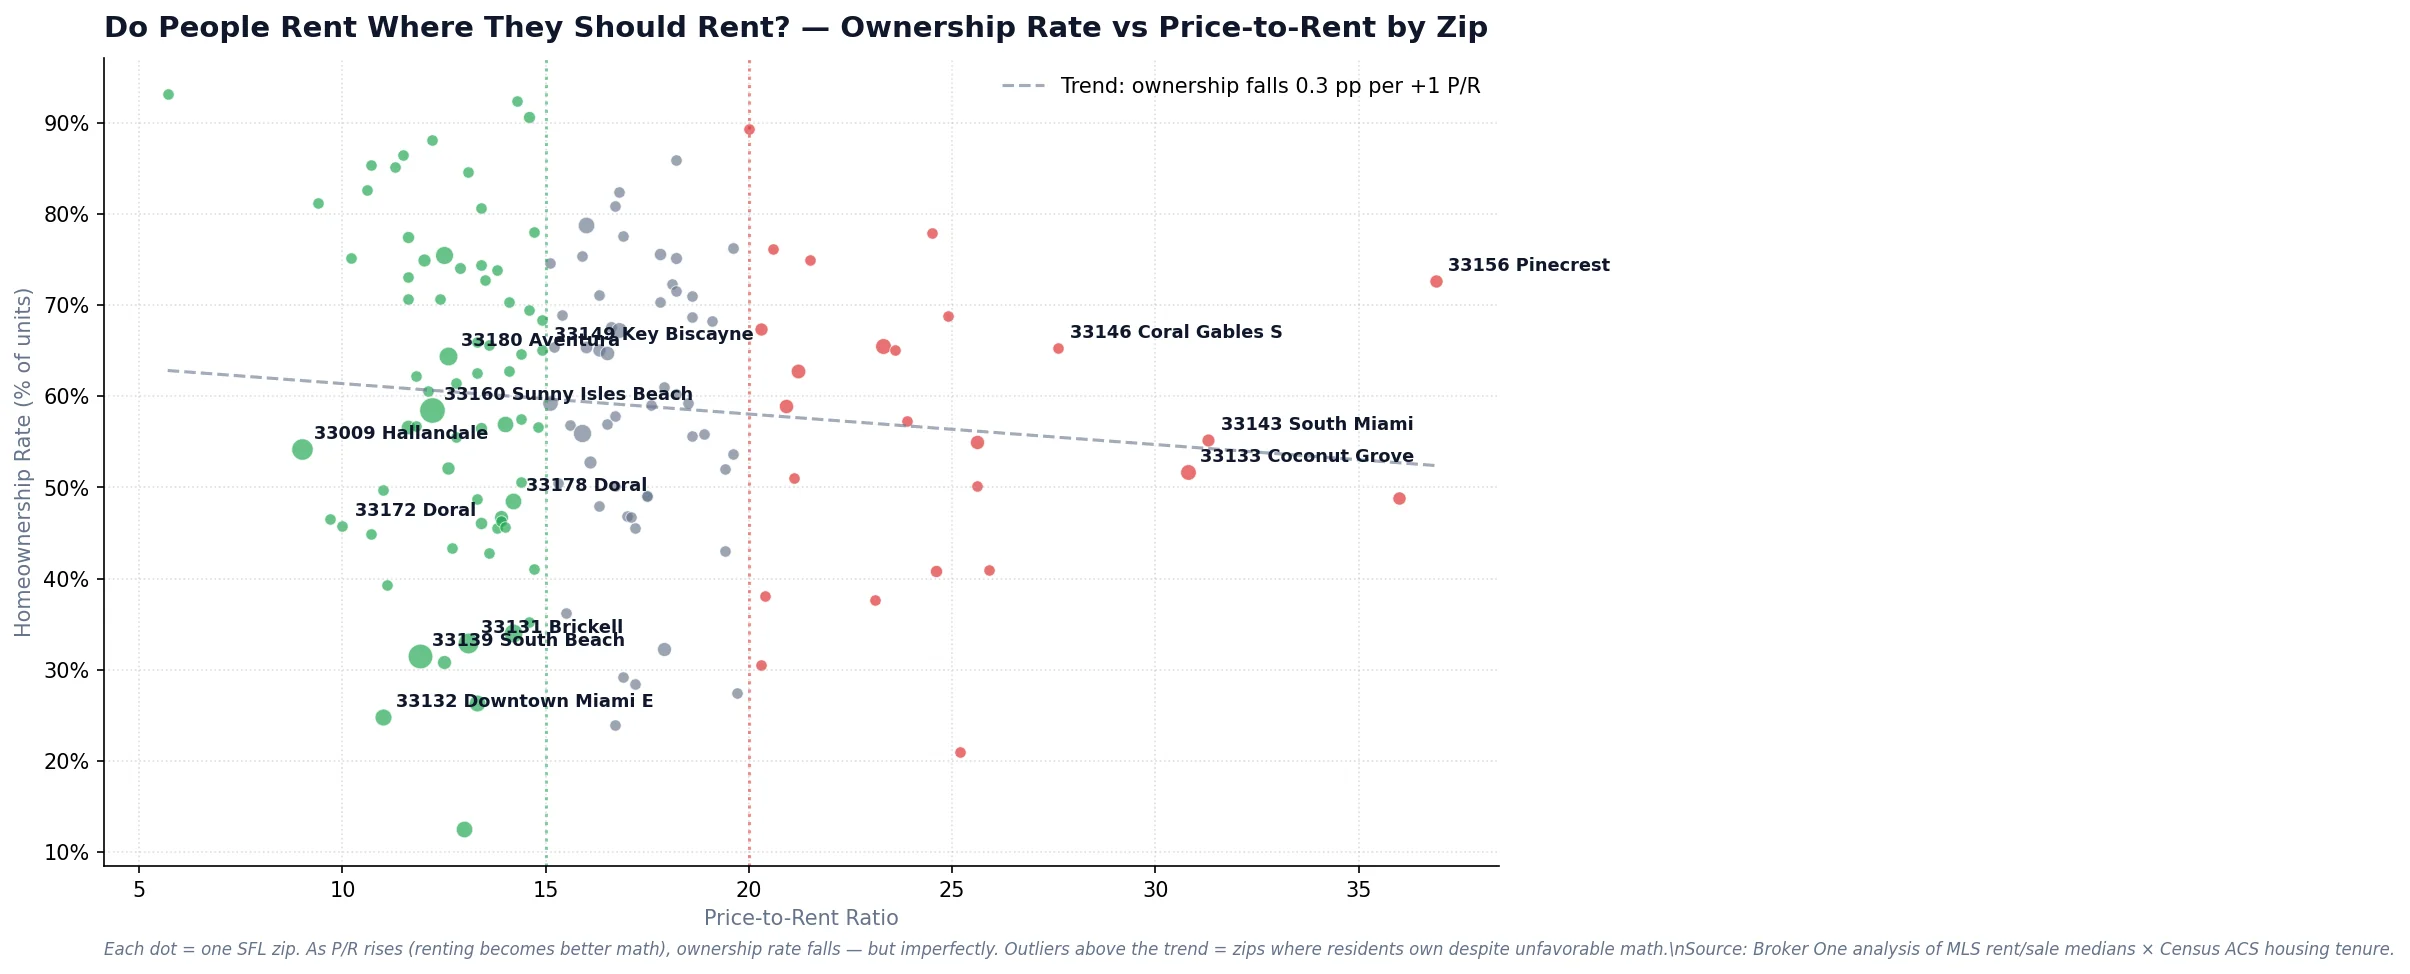
Does The Market Actually Behave This Way?
A fair test: if the P/R signal is real, we should see higher ownership rates in the "cheap to buy" zips and lower ownership rates in the "expensive to buy" zips. We matched our P/R data to the 2022 ACS homeownership rate from the U.S. Census for every zip in our sample:
Zip-level P/R ratio vs homeownership rate, with linear regression. The signal is unambiguous: the higher a zip's price-to-rent ratio, the lower its ownership rate — households rationally revealed-prefer renting where P/R is high.
The relationship is visibly negative and statistically meaningful. Zips with P/R < 12 typically show ownership rates of 60-75%. Zips with P/R > 25 show ownership rates of 40-55%. Households aren't making this choice because they read a P/R article — they're making it because the monthly cash-flow math pushes them toward rent when owning stops making sense.
The neighborhoods where your friends keep saying "I'd love to buy here but it doesn't pencil out" are, statistically, exactly the neighborhoods where renting is in fact the smarter play. The people already living there figured it out first.
Caveats We Know You're Thinking About
"But I'll build equity if I buy."
Only if prices rise enough. If the condo in South Beach you buy today for $500K is worth $500K in five years (very plausible given the ongoing correction), you built zero equity beyond your principal paydown minus transaction costs. The renter next door who put the would-be down payment into an index fund at 7% annualized for five years is ahead by roughly $40K net-net, adjusted for everything. The P/R framework assumes zero price appreciation, which is the most honest baseline in a correcting condo market.
"What about HOA fees, taxes, insurance?"
These are already priced into the rental market. When HOAs double in a building, the owner's cost rises — but so does the rent a new tenant pays, because the landlord passes it through. In 2024-2026 Miami, HOA and insurance doubled both for owners and (via rents) for tenants. That's why the ratio framework still works: both sides of the fraction move together.
Where it breaks: primary-residence homestead exemptions (available only to owners) can shave 15-25% off your effective carrying cost and shift a marginal 18-20 P/R zip into clear buy territory. Worth running the numbers on a specific address.
"I plan to move in two years."
Don't buy. At any P/R ratio above ~12, two years of ownership costs (closing costs, selling costs, transaction friction, interest-heavy early-year mortgage payments) eat your equity before appreciation has time to compound. Buy only when you have reason to believe you'll be in the home for 5+ years, period.
"I want to own for non-financial reasons."
Completely valid. Owning lets you paint the walls, keep a dog, not have a landlord, and anchor to a place. The P/R framework is only about the financial comparison — not about whether ownership is worth it for you personally. If a zip has P/R = 30, you're paying a 50% premium for those non-financial benefits. Decide if it's worth it.
How To Use This Data
A practical path, in order:
Identify three or four zip codes you actually want to live in (schools, commute, neighborhood feel).
Look up their P/R ratios from our tables above. If any are under 15, those are your "buying is already cheaper than renting" candidates.
For each candidate, estimate your specific carrying cost: mortgage payment at current rates, property tax at assessed value × 2% typical, HOA (for condos), insurance, maintenance budget at 1% of home value per year.
Compare against the median rent for the same zip. If carrying cost < rent × 1.15, buying is mathematically favored. If carrying cost > rent × 1.30, rent.
Add back the homestead exemption adjustment if you'll owner-occupy.
Decide how long you plan to stay. Under 5 years: rent regardless. Over 10 years: buy in any P/R < 20 zip, rent in any P/R > 25.
The single most common mistake we see is buying in a P/R > 25 zip because "it's a great neighborhood" without recognizing that the great neighborhood is priced into the sale but not into the rent. The fix is simple: acknowledge you're paying a premium for the neighborhood, decide if it's worth it, and move on.
Methodology
Source data: Broker One proprietary database. Rental side: every residential active-or-recently-closed rental listing in Miami-Dade, Broward, and Palm Beach counties with a listed monthly rent. Sale side: every closed residential sale in the last 12 months. Ratios computed at the 5-digit zip-code level. Zips included: those with at least 30 observations on both the sale side and the rental side — 147 zips met that bar. Homeownership data: American Community Survey 5-year estimates, 2018-2022, at zip code tabulation area. Analysis through April 21, 2026.
Price-to-rent ratio formula: median sale price ÷ (median monthly rent × 12). Interpretation thresholds follow widely-used conventions (P/R < 15 buy-favored, > 20 rent-favored); they are heuristics, not laws.
Broker One Research is the data-journalism arm of Broker One. Every post under this byline is backed by an original SQL analysis across our proprietary datasets: 2M Florida parcels from county appraisers, 4.6M active and historical MLS listings, 6.9M Florida business entities from Sunbiz, FEMA flood zones, building permits, code violations, and Census ACS demographics. We publish our methodology — row counts, filters, date ranges — so readers can evaluate the rigor of every finding. We use median-based metrics rather than means to keep MLS data-entry outliers out of headline numbers. If you're a journalist or researcher who wants to cite our work, email research@mybrokerone.com.