On September 23, 2025, UBS published its Global Real Estate Bubble Index and crowned Miami the world's #1 bubble-risk city with a score of 1.73. The report cited "a sharp disconnect between soaring home prices and stagnant rents, with affordability near record lows." Bloomberg, the Financial Times, local TV news, and real-estate X amplified the finding for weeks.
So: is Miami crashing?
We ran the numbers ourselves. The headline is wrong — but for a more interesting reason than most people think.
The Problem With "The Miami Market"
The UBS index scores cities as single markets. Miami is not a single market. It's two different markets with opposite trajectories, and mashing them into one number produces a statistic nobody who actually transacts here would recognize.
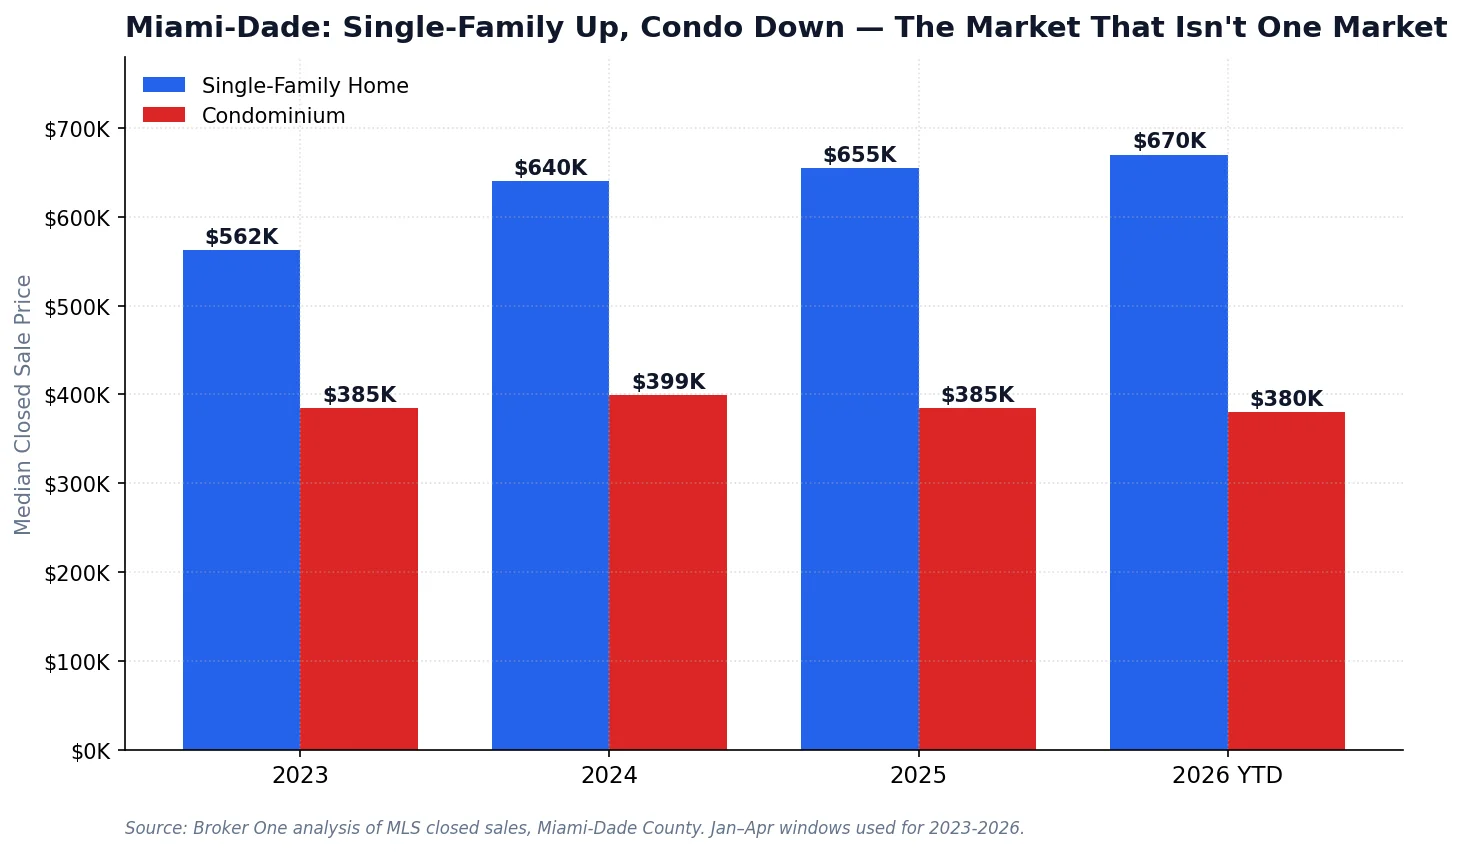
Miami-Dade single-family homes have appreciated 19% since 2023. Over the same period, condo prices are down 5% from their 2024 peak. The metro aggregate hides the divergence.
Miami-Dade single-family home prices in Q1 2026:
2023 median closed price: $562,500
2024: $640,000 (+13.8%)
2025: $655,000 (+2.3%)
2026 YTD: $670,000 (+2.3%)
Over the same 36 months, Miami-Dade condos went in the opposite direction. Median closed price fell from $399,000 in 2024 to $380,000 in 2026 — a 4.8% decline at the metro level. Inside specific neighborhoods the damage is far worse.
So the UBS "Miami bubble" headline is structurally misleading. There is no bubble in Miami-Dade single-family housing — that segment is still appreciating, backed by genuine population inflow, constrained by zero-available-land reality, and underwritten by a migration pattern that hasn't reversed. The correction is happening exclusively in the condo market, and that correction has a very specific cause.
Weekly Inventory: The Supply Shock Is Already Here
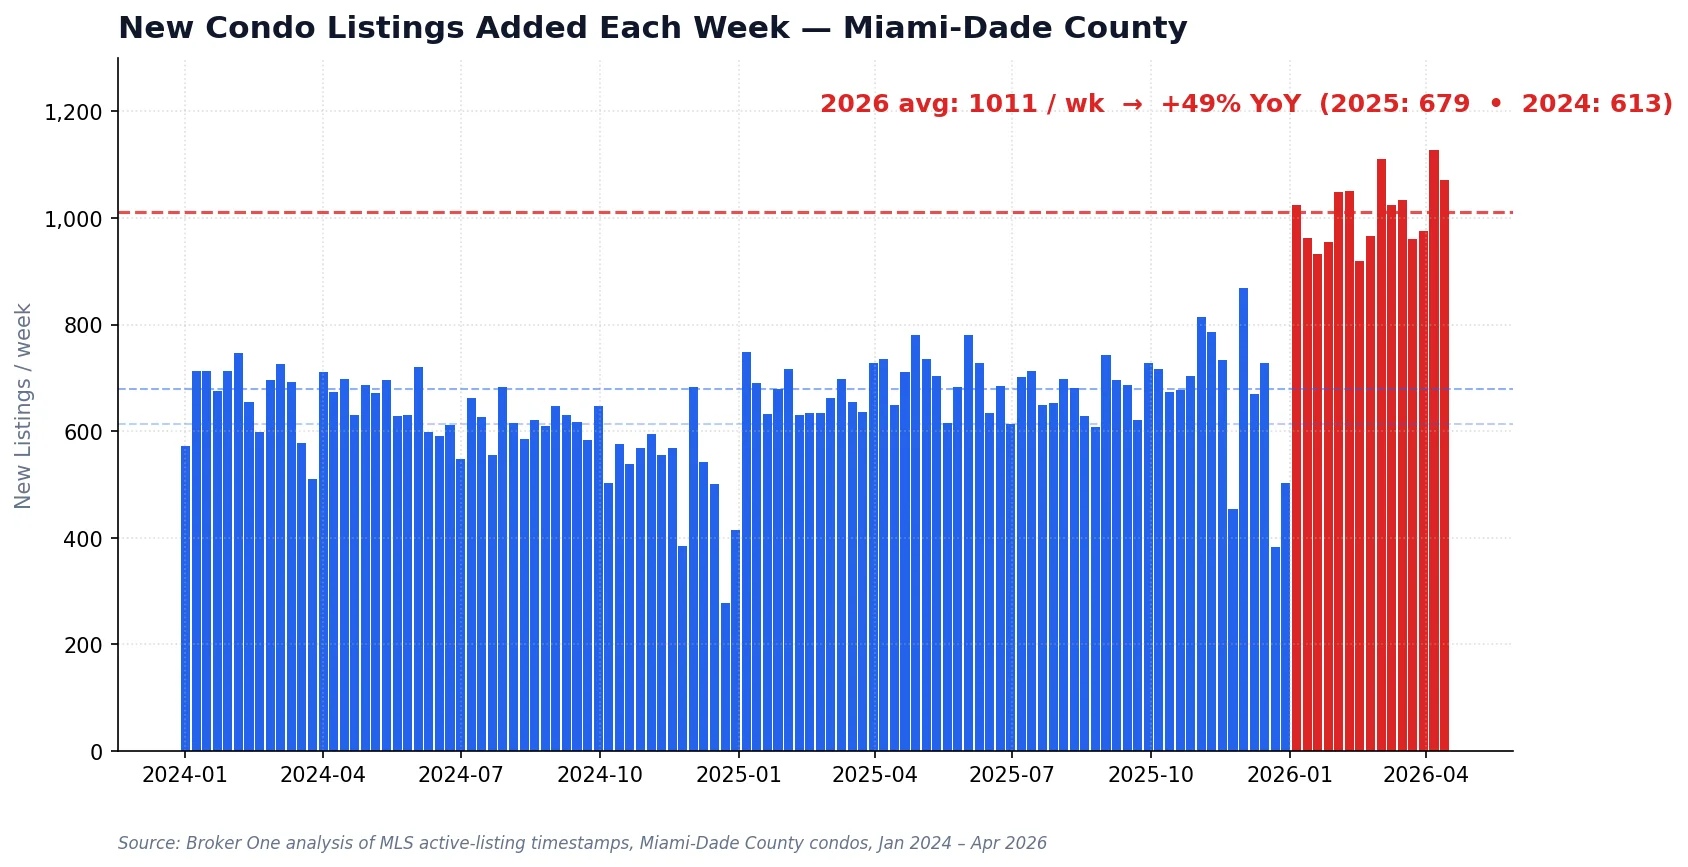
"Weekly inventory" is the real-estate equivalent of a heart monitor. Closed sales are backwards-looking (a deal that closes today went under contract 60-75 days ago). New listings posted this week tell you what's actually happening right now — what sellers believe they can get, and how many of them have run out of patience.
Miami-Dade saw 613 new condo listings per week in 2024. In 2025 that rose to 679. In 2026 so far it's 1,011 — a 49% year-over-year surge in sellers racing to the exit.
In 2024, Miami-Dade averaged 613 new condo listings per week. In 2025, 679. So far in 2026, 1,011 per week — a 49% YoY jump in fresh supply. The peak week of 2026 so far (April 6) hit 1,127 new condo listings — nearly double a typical 2024 week.
By comparison, single-family new listings also rose but at half the rate — roughly 20-27% YoY across the same months. The flood is condo-specific.
A single-digit-percent median-price decline hides this, because the buyers who are closing are the ones who found acceptable deals. The real damage is in the listings that aren't selling and in the sellers who are dropping their asking price week after week. With supply running 50% above demand, that damage will keep compounding for several more quarters.
What Actually Caused This
The condo correction is not a generic "bubble popping." It has three specific drivers, stacked:
1. Senate Bill 4-D (the compliance cliff)
After the 2021 Surfside collapse, Florida passed SB 4-D — requiring structural integrity reserve studies and fully funded reserves for every condo building over 3 stories. The deadline is December 31, 2026. Roughly 56% of Miami-Dade condos were non-compliant when the last industry survey ran. Special assessments now range from $50,000 to $400,000+ per unit, on top of the regular HOA dues.
Owners of older oceanfront buildings are receiving bills that exceed what they originally paid for the unit. Some are paying. Many are selling. Almost all of them are flooding the market simultaneously in the 12 months before the SB 4-D deadline.
2. Financing froze up
After Surfside, Fannie Mae and Freddie Mac added "condo questionnaire" requirements that disqualify thousands of buildings from conforming loan eligibility. If a building has unfunded reserves, deferred maintenance, or pending litigation, buyers can't get a standard mortgage. That turns every non-compliant building into a cash-only market, which collapses the buyer pool and crushes pricing.
3. Insurance doubled. HOAs doubled.
Florida condo insurance rates roughly doubled from 2022-2025 as carriers absorbed Surfside, Ian, Milton, and higher reinsurance costs. HOA fees on the median Miami condo moved from $500-700/month to $800-1,200+ as buildings funded both the reserves and the insurance premiums. For a $400,000 condo, a $1,500/month HOA is genuinely unsustainable for most working-age buyers.
Stack all three — SB 4-D assessments, financing freeze-out, and carrying cost doubling — and the math stops working for both the seller (who can't afford to hold) and the buyer (who can't afford to close). Inventory piles up. Prices drift.
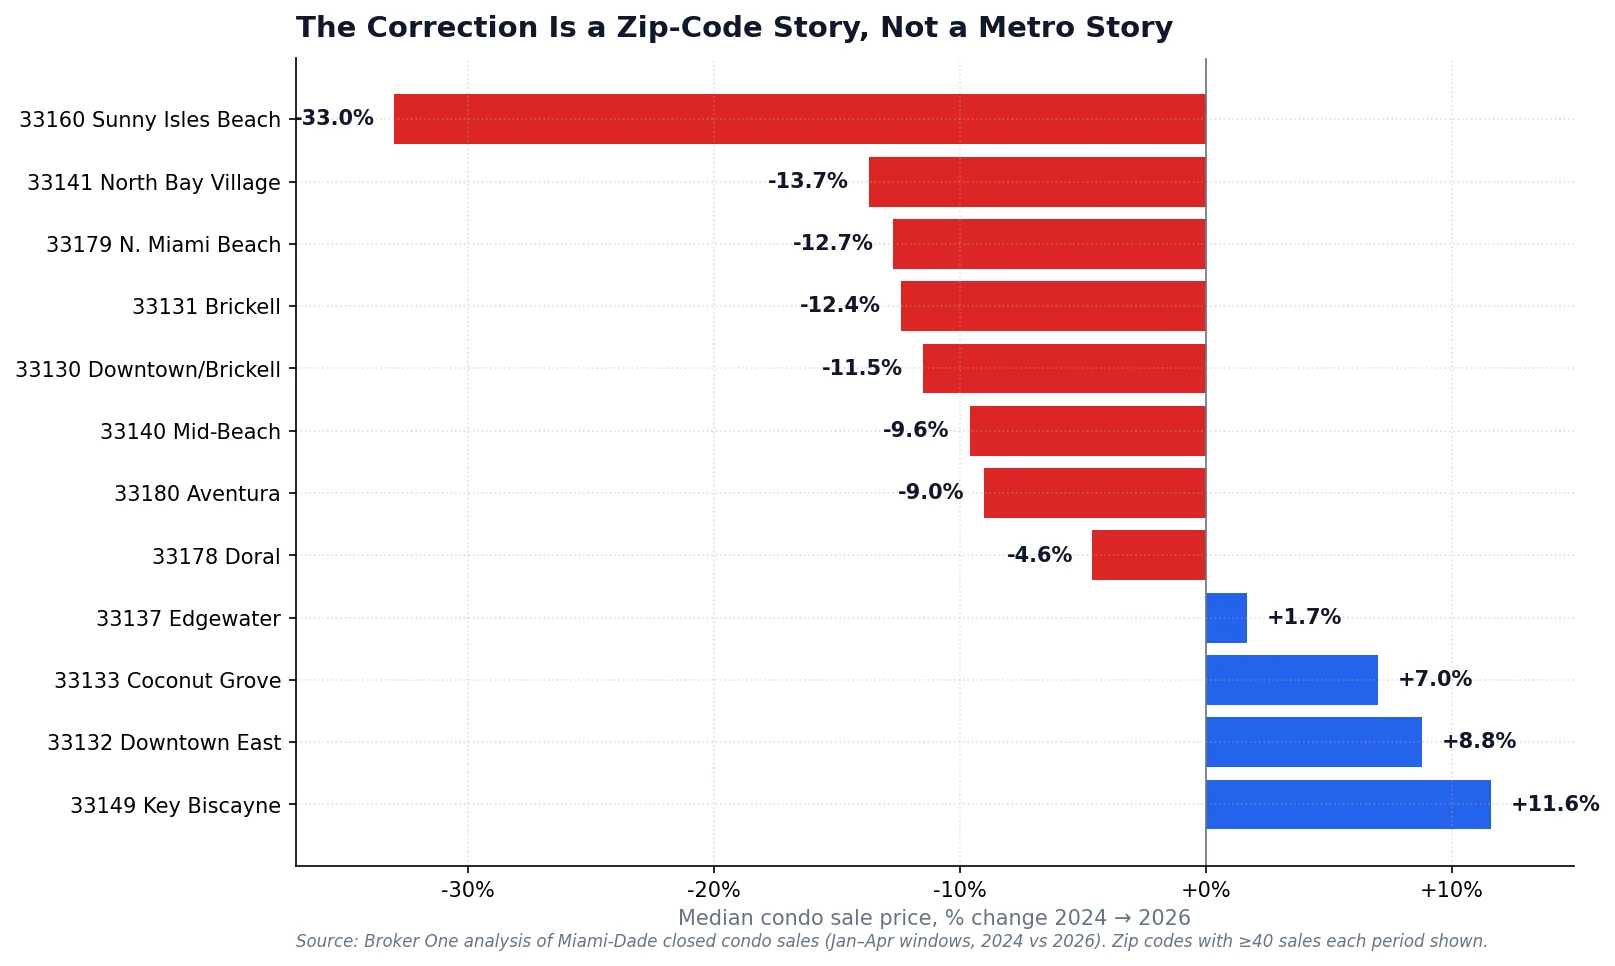
The Correction Is a Zip-Code Story
Condo price changes vary more by zip code than any published "Miami median" could capture. Below is our analysis of every Miami-Dade zip with at least 40 closed condo sales in both 2024 and 2026 Q1.
The correction hits oceanfront tower-heavy zips hardest. Sunny Isles Beach (33160) leads the decline at -33%. Key Biscayne, Downtown East, Coconut Grove, and Edgewater have moved in the opposite direction.
The declines concentrate in older oceanfront-tower zip codes — exactly where SB 4-D exposure is highest:
33160 Sunny Isles Beach: -33.0%
Aging oceanfront towers, many pre-1994, high assessment exposure. The $660K 2024 median fell to $442K by Q1 2026. Some individual pre-4-D buildings have seen listing prices drop 40-50% from pre-Surfside peaks as specific units hit the market after assessments.
33131 Brickell: -12.4%
Different driver — not SB 4-D, but new-construction supply. Every major Brickell tower delivered between 2022 and 2025 added hundreds of units to a market already absorbing investor-flip inventory. Resale prices are adjusting to new-construction comp pressure.
33141 North Bay Village & 33179 North Miami Beach: -13.7% / -12.7%
Similar to Sunny Isles — older mid-rise buildings, heavy SB 4-D exposure, weak financing, thin buyer pool.
And yet in the same county, four condo zips are up:
Key Biscayne (33149): +11.6% — island supply constraint is absolute, buyer profile skews ultra-high-net-worth cash.
Downtown East (33132): +8.8% — driven by a handful of newer brand-name deliveries at premium prices.
Coconut Grove (33133): +7.0% — limited condo inventory, walkable-neighborhood premium.
Edgewater (33137): +1.7% — ahead of the curve on new-generation, post-Surfside-compliant buildings.
The Counterintuitive Finding: New Luxury Is Falling Harder Than Old Aging Stock
Conventional wisdom says the SB 4-D factor should make pre-1994 condos the distressed segment. The data only half-confirms this.
Pre-1994 condos are falling — but they're falling less than post-1994 condos. Why? Because the pre-1994 segment already went through a Surfside-driven repricing in 2022-2023. The exposure was public, buyers discounted accordingly, and the asset class settled at a lower base.
Post-1994 condos — often the "safer" option in buyers' minds — were priced as if they were immune to the broader market dynamics. They're not. As financing tightens, as insurance costs rise, and as the general condo buyer pool shrinks, even compliant-by-construction buildings feel the pressure. Their 2024 peaks were inflated by pandemic-era demand, and that inflation is now bleeding out.
In dollar terms, the post-1994 Miami condo has lost $65,000 in median value since 2024 — more than the pre-1994 segment lost in absolute dollars. The buyers who thought they were being safe by going newer are currently underwater faster than the value buyers who bought beaten-down older stock.
Is This a Crash?
No. A crash implies rapid, broad-based capitulation — foreclosures cascading, banks insolvent, median prices down 30%+ across housing types. None of that is happening. Single-family is appreciating. Luxury top-tier condos (Fisher Island, Key Biscayne, Indian Creek) are stable or up. Sales volume in most segments is near 2024 levels, not collapsed.
This is a segmented correction, not a crash. Specifically:
Mass-market condo in SB 4-D-exposed buildings (1970s-1990s oceanfront towers) — 20-35% down and still dropping.
New-construction-heavy condo submarkets (Brickell, Edgewater, Downtown) — 10-15% down, supply-driven, will stabilize as deliveries absorb.
Ultra-luxury single-tower buildings & waterfront — stable to up, scarcity and cash buyers insulate them.
Single-family housing metro-wide — still appreciating, no crash signal at all.
What This Means by Buyer Profile
If you're a condo buyer
You are in the strongest negotiating position Miami has seen in a decade. With 1,000+ new listings hitting the market weekly and roughly 8 months of standing inventory, you can demand pre-inspection reserve studies, open financing contingencies, and asking-price discounts of 10-20% in most SB 4-D-exposed buildings. Ask for the full reserve study and 40-year recertification status on any building you consider. Buildings that already completed their compliance work are worth a premium over the others — they're done with the biggest cost shock.
If you're a condo seller
The math of the market says list aggressively, not hopefully. Overpriced condos in SB 4-D-exposed buildings sit on market 200-300 days and then sell at 15-25% below original ask. If you must sell, price at a 10-15% discount to your 2023-2024 mental-anchor and you'll clear. If you can hold another 18-24 months through full SB 4-D compliance and the absorption of new-construction supply, many neighborhoods will begin recovering — particularly the post-compliance buildings in Brickell, Edgewater, and Aventura.
If you're a single-family buyer
Your market is not the one on the news. Inventory remains tight in top zips, school-zone premiums are real, and prices are still climbing. Don't expect the "Miami crash" narrative to give you leverage you don't have. If anything, the condo market's troubles are pushing would-be condo buyers into the SFH market as a "safer" store of value — which is part of why SFH keeps appreciating.
If you're an investor
The genuinely interesting opportunity right now is post-compliance condos: buildings that already did their SIRS, levied the assessments, funded their reserves, and now carry no SB 4-D overhang. These are selling at 2022 or earlier pricing, fully financeable, with HOAs that are already at their new normal. The buyers most motivated by fear are avoiding them for generic "condo risk" reasons — which is exactly the pricing inefficiency.
The Verdict
Miami is not crashing. A specific segment of the Miami market — roughly 40-50% of the condo stock, concentrated in SB 4-D-exposed oceanfront towers and in neighborhoods with heavy new-construction deliveries — is going through a 12-36 month repricing. That repricing is being reported as a "Miami crash" and will continue to be reported that way by national media looking for headlines.
The actual local picture is more nuanced and more useful: the condo segment is where the prices are, the single-family segment is where the prices aren't. UBS's bubble methodology averaged those two realities together and produced a score that technically quantifies Miami's condo stress as "bubble risk" — but only if you're willing to describe a segmented correction as a bubble. In plain language, it's a long-foreseen structural repricing of one asset class driven by identifiable regulation, insurance, and financing pressures, now passing through the market over roughly 24-36 months.
If you're transacting in Miami this year, ignore the single-score headline. The neighborhood, the building age, the reserve status, and the compliance history determine your outcome. Everything else is noise.
Methodology
Source: Broker One internal database. MLS closed-sale records (Miami-Dade County) filtered to residential condominium and single-family property types. Median prices calculated from January 1 through April 21 of each reported year for comparability. Weekly new-listing counts derived from OnMarketDate timestamps, full weeks only. Zip-level analysis restricted to zip codes with at least 40 closed condo sales in both 2024 and 2026 windows. Era split uses year-built before or after 1994, the cutoff commonly used for Florida coastal code upgrades and the inflection point for SB 4-D compliance severity. All data current as of the publication date.
External references: UBS Global Real Estate Bubble Index 2025, Florida Senate Bill 4-D (2022), Fannie Mae Selling Guide B4-2.1-03 (condominium project eligibility).
Broker One Research is the data-journalism arm of Broker One. Every post under this byline is backed by an original SQL analysis across our proprietary datasets: 2M Florida parcels from county appraisers, 4.6M active and historical MLS listings, 6.9M Florida business entities from Sunbiz, FEMA flood zones, building permits, code violations, and Census ACS demographics. We publish our methodology — row counts, filters, date ranges — so readers can evaluate the rigor of every finding. We use median-based metrics rather than means to keep MLS data-entry outliers out of headline numbers. If you're a journalist or researcher who wants to cite our work, email research@mybrokerone.com.